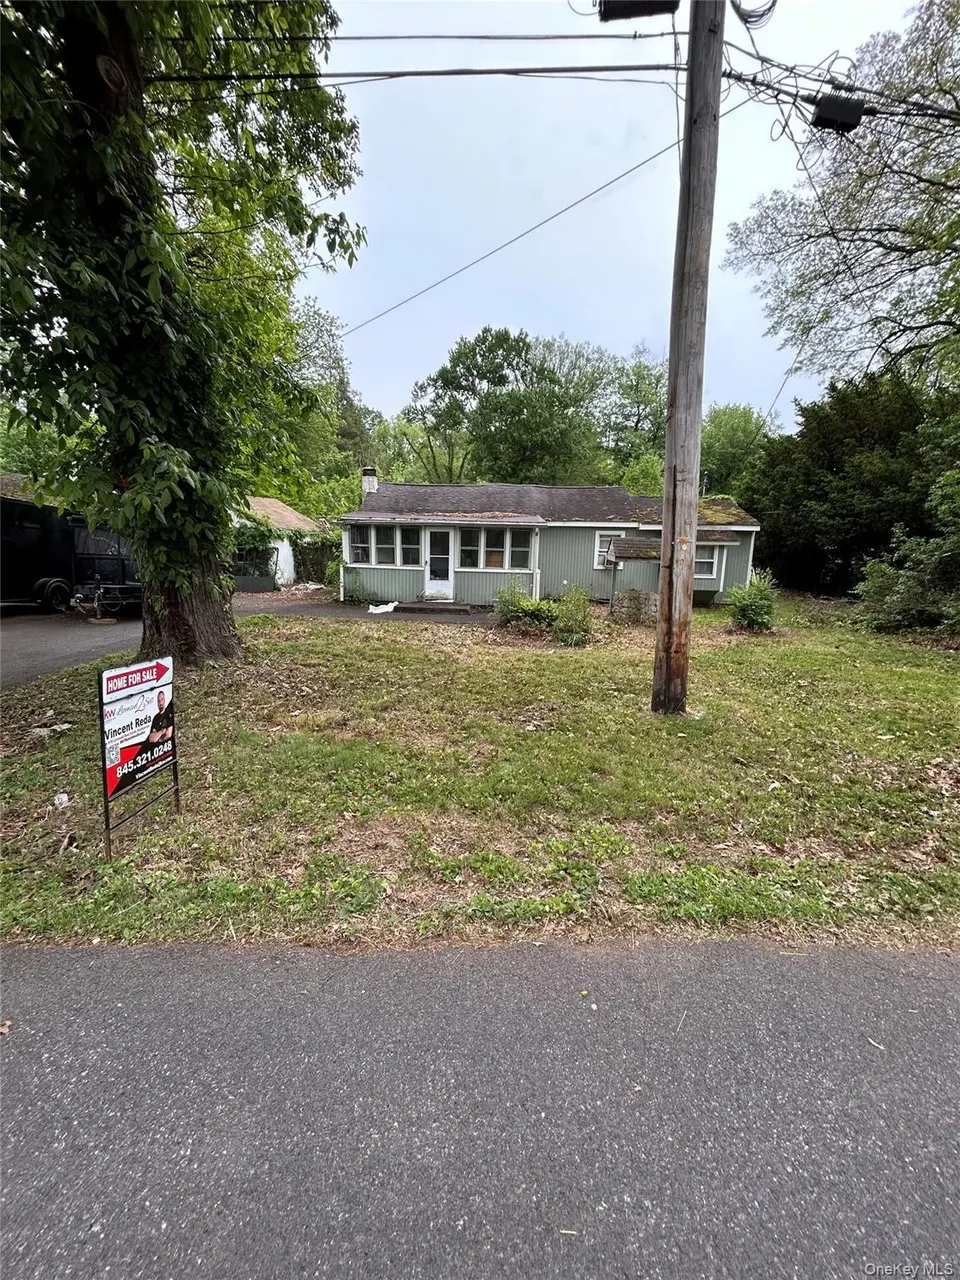
155 Glenerie Blvd
Ruby, NY 12477
$99,999B-
2 bd · 1.5 ba ·
1,476 sqft ·
Built 1929
· SingleFamily
· Active
· 20 DOM
Cashflow @ list (25.0% down · 7.5%)
Estimated rent
$2,215/mo
Mortgage (P&I)
−$524
Tax + insurance
−$327
HOA
−$0
Vac / Maint / Mgmt
−$465
Net cashflow
$898/mo
Annual
$10,782/yr
Cap rate
17.07%
Cash-on-cash
38.51%
DSCR
2.71
1% rule
2.21%
Cash to close
$28,000
Investor read
- This is a 2-bed/1.5-bath single-family listed at $100k.
- At list price, monthly cash flow is $898 ($11k/yr) — positive.
- The deal already cash-flows at list — no discount required.
- Meets the 1% rule at list price ($2k rent vs $100k).
- It's been on market 20 days — a 2% lower offer ($98k) is reasonable based on typical stale-listing flexibility.
- Recommended offer: $98k (1.5% below list) — sets the bar for market timing.
- Local home prices are declining (-3.0%/yr); year-one equity from $691 of loan paydown is wiped out by about $3k of value loss. Plan a longer hold.
- Location reads: area grade B — affects rentability + tenant quality, not the cash-flow math above.
- Kingston City School District (urban): math 44% / reading 59% proficiency, ranked #355 of 590 in NY (top 60%) — acceptable for families but not a draw, mixed tenant base, ~2y average lease.
- Zoned schools: E R Crosby Elementary School (math 37% / reading 57%, grade D-, #1,195 of 2,108 statewide, top 60%, 303 students, 61% FRL); M Clifford Miller Middle School (math 21% / reading 37%, grade F, #566 of 729 statewide, top 78%, 822 students, 65% FRL); Kingston High School (math 94% / reading 91%, grade A+, #153 of 1,100 statewide, top 14%, 1,856 students, 85% FRL) — zoned schools average 70% FRL vs 45% district-wide (25 pts higher); higher-poverty schools than district average — tighter screening recommended.
- Watch-outs: property tax is 3.4% of price; built in 1929 — expect roof / HVAC / electrical / plumbing capex.
- Market conditions: 173 active listings in the ZIP; solid renter incomes; 464 units permitted in Ulster County in 2024 (170 in 5+ unit buildings).
- Ulster County population projected at -14% by 2050 — secular population decline; favor cash flow + early exit over multi-decade hold.
- Current owner paid $39k; list at $100k implies a 156% gain — meaningful room to come down on a strong offer.
- At projected returns (-3.0% appreciation + 3.0% rent growth), your $28k cash investment doubles in ~4 years — after that, you're playing with house money.
- Climate carrying-cost: moderate flood risk — expect insurance premiums to compound above CPI over the hold.
- Cap rate 17.1% vs local median 2.5% in Ruby — top-decile yield for the area; either an underpriced asset or a hidden risk that comps aren't pricing in. Stress-test before assuming the spread holds.
- This rent runs 33% of the median local income ($81k/yr) — at the standard rent-burdened threshold; future hikes will face affordability resistance.
Questions for listing agent
- Built in 1929 — when were the roof, HVAC, electrical panel, plumbing, and water heater last replaced?
- Property tax is high relative to price — has the assessment been appealed recently, and will the sale trigger a re-assessment?
- Is there a deadline driving the sale (1031 exchange, divorce, estate, relocation)? That informs how much negotiation room exists.
- What's the average days-on-market for RENTAL listings here right now (not sales)? A rising rental-DOM trend means longer vacancies and softer asking-rent achievability than the comps imply.
- What's the recent tenant-quality profile in this submarket — average credit score on applications, eviction rate, late-payment / NSF rate, and stable-employment percentage? A property-management company in the area should have these aggregated.
- How much new for-sale + rental construction is in the pipeline within 1–3 miles? Heavy new supply typically softens prices + rents 12–24 months out; constrained supply supports both.
CashFlowRE · CFR-MAJM07152BST96
· Data 1 day ago
cashflowre.app · 2026-05-29