155 Glenerie Blvd · Ruby, NY
Flood risk 5/10 · Moderate
- FEMA flood zone
- X (shaded)
- Chance of flooding over 30 yrs
- 0.24%
- Est. flood insurance / yr
- $507 – $1,088
Fire risk 3/10 · Minor
- Est. fire insurance / yr
- $691 – $1,283
Heat risk 4/10 · Minor
- Hot days now (above 99°F)
- 7 days/yr
- Hot days in 30 yrs
- 15 days/yr
Wind risk 3/10 · Minor
- Chance of severe wind over 30 yrs
- 8.0%
Air-quality risk 2/10 · Minimal
- Unhealthy air days now
- 1 days/yr
- Unhealthy air days in 30 yrs
- 1 days/yr
Risk factors via First Street. Map © Google.
Why this score? — see what drove the B- grade
The composite is a weighted blend of 9 inputs, each scored 0–100. Each bar is that input's sub-score; the figure is the points it added to the 100-point composite (weight × sub-score).
- Cash flow +30.0/30.0
- 1% rule +10.0/10.0
- DSCR +10.0/10.0
- ARV discount +7.5/15.0
- Schools +4.4/10.0
- Rent growth +2.5/5.0
- Livability +2.5/5.0
- Condition / age +2.5/5.0
- Appreciation +0.0/10.0
$99,999
🖨 Deal sheet 📄 Offer letter ✓ Due diligence
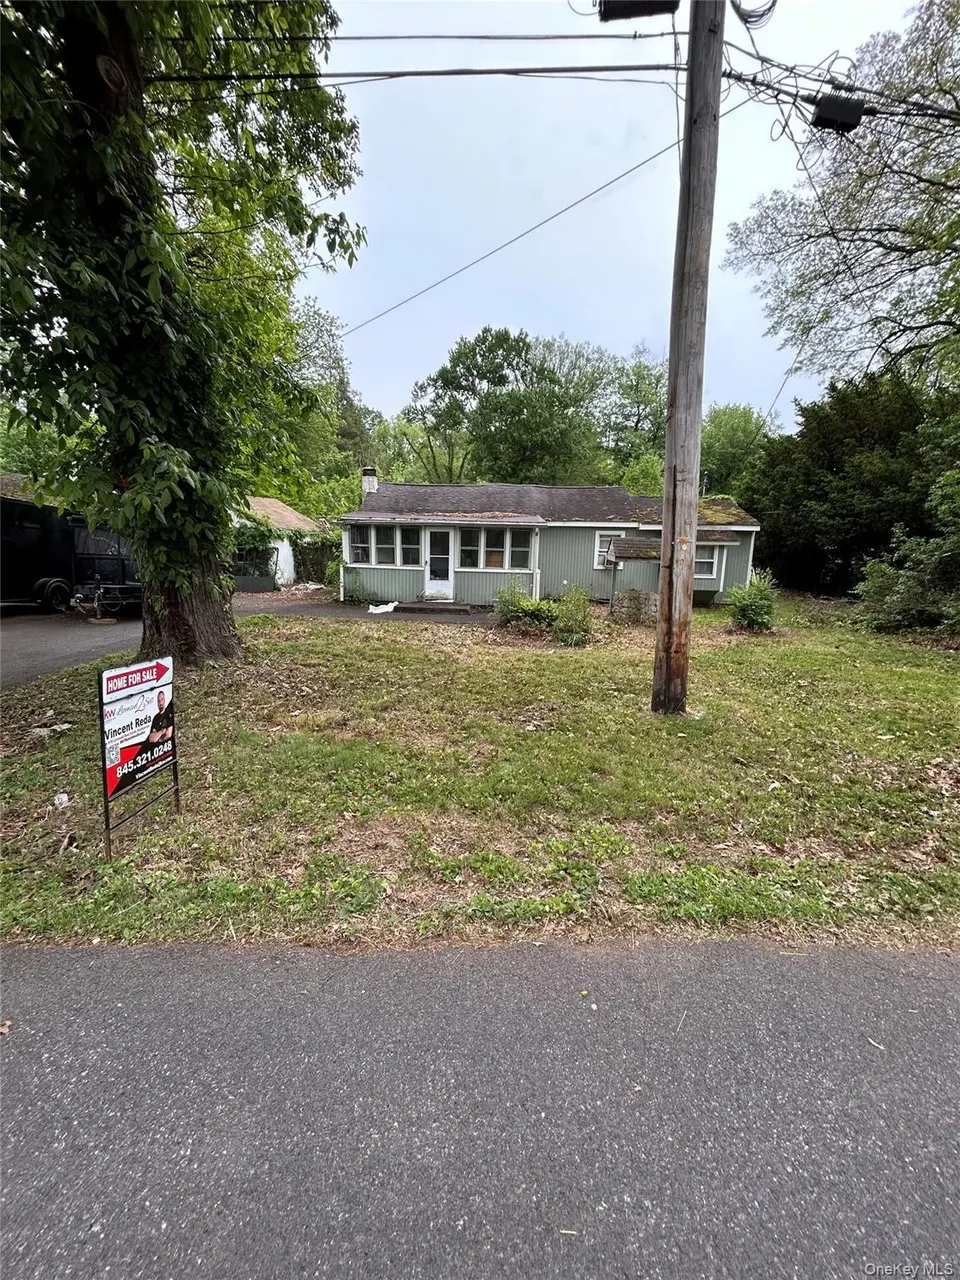
Listing remarks
155 Glenerie Blvd | Saugerties, NY 12477 2 Bed | 1.5 Bath | 1,476 Sq Ft | 0.60 Acre | $99,999 Opportunity awaits at 155 Glenerie Blvd in the Town of Saugerties! This 2-bedroom, 1.5-bath single-family home sits on a generous 0.60-acre lot, offering plenty of outdoor space and room to breathe. Built in 1926, the property features 1,476 square feet of living space with solid bones and tremendous potential for the right buyer. Whether you're an investor looking to add to your portfolio, a renovator ready to bring your vision to life, or a buyer seeking an affordable entry point into the Hudson Valley real estate market — this property is priced to move and ready for its next chapter. Con
Key facts
- 0.6 acre lot
- Garage
- Built 1929
Property features AI
Finance
- HOA & community: Senior community
Exterior
- Parking: Detached garage; 1 garage space; No carport
- Utilities: Septic tank sewer; Electricity connected; Natural gas connected; Water connected
- Home design: Single family residence; Living area per public records
- Construction: Wood siding construction
- Exterior features: Wood siding; Not waterfront
Interior
- Kitchen: No appliances listed
- Bedrooms: 6 total rooms (includes bedrooms and living areas)
- Bathrooms: 1 full bathroom; 1 half bathroom
- Heating & cooling: Electric heating; Forced air heating; Oil heating; Other heating; No central cooling
- Interior features: Porch with screened area; Crawl space basement
- Laundry & utility: No laundry appliances listed
Neighborhood map
What this means for you Summary
Snapshot
- This is a 2-bed/1.5-bath single-family listed at $100k.
Deal economics
- At list price, monthly cash flow is $898 ($11k/yr) — positive.
- The deal already cash-flows at list — no discount required.
- Meets the 1% rule at list price ($2k rent vs $100k).
- Recommended offer: $98k (1.5% below list) — sets the bar for market timing.
- Cap rate 17.1% vs local median 2.5% in Ruby — top-decile yield for the area; either an underpriced asset or a hidden risk that comps aren't pricing in. Stress-test before assuming the spread holds.
Location & tenants
- Location reads: area grade B — affects rentability + tenant quality, not the cash-flow math above.
- Kingston City School District (urban): math 44% / reading 59% proficiency, ranked #355 of 590 in NY (top 60%) — acceptable for families but not a draw, mixed tenant base, ~2y average lease.
- Zoned schools: E R Crosby Elementary School (math 37% / reading 57%, grade D-, #1,195 of 2,108 statewide, top 60%, 303 students, 61% FRL); M Clifford Miller Middle School (math 21% / reading 37%, grade F, #566 of 729 statewide, top 78%, 822 students, 65% FRL); Kingston High School (math 94% / reading 91%, grade A+, #153 of 1,100 statewide, top 14%, 1,856 students, 85% FRL) — zoned schools average 70% FRL vs 45% district-wide (25 pts higher); higher-poverty schools than district average — tighter screening recommended.
- Market conditions: 173 active listings in the ZIP; solid renter incomes; 464 units permitted in Ulster County in 2024 (170 in 5+ unit buildings).
- This rent runs 33% of the median local income ($81k/yr) — at the standard rent-burdened threshold; future hikes will face affordability resistance.
Forward outlook
- Local home prices are declining (-3.0%/yr); year-one equity from $691 of loan paydown is wiped out by about $3k of value loss. Plan a longer hold.
- Ulster County population projected at -14% by 2050 — secular population decline; favor cash flow + early exit over multi-decade hold.
- At projected returns (-3.0% appreciation + 3.0% rent growth), your $28k cash investment doubles in ~4 years — after that, you're playing with house money.
Negotiation context
- It's been on market 20 days — a 2% lower offer ($98k) is reasonable based on typical stale-listing flexibility.
- Current owner paid $39k; list at $100k implies a 156% gain — meaningful room to come down on a strong offer.
Risks & watch-outs
- Watch-outs: property tax is 3.4% of price; built in 1929 — expect roof / HVAC / electrical / plumbing capex.
- Climate carrying-cost: moderate flood risk — expect insurance premiums to compound above CPI over the hold.
Questions for the listing agent
- Built in 1929 — when were the roof, HVAC, electrical panel, plumbing, and water heater last replaced?
- Property tax is high relative to price — has the assessment been appealed recently, and will the sale trigger a re-assessment?
- Is there a deadline driving the sale (1031 exchange, divorce, estate, relocation)? That informs how much negotiation room exists.
- What's the average days-on-market for RENTAL listings here right now (not sales)? A rising rental-DOM trend means longer vacancies and softer asking-rent achievability than the comps imply.
- What's the recent tenant-quality profile in this submarket — average credit score on applications, eviction rate, late-payment / NSF rate, and stable-employment percentage? A property-management company in the area should have these aggregated.
- How much new for-sale + rental construction is in the pipeline within 1–3 miles? Heavy new supply typically softens prices + rents 12–24 months out; constrained supply supports both.
Investment metrics
- 1% rule
- 2.21% ✓
- Cap rate
- 17.07%
- Cash-on-cash
- 38.51%
- DSCR
- 2.71
- GRM
- 3.8
CMA / ARV
- ARV (on-the-fly)
- $339,480
- Comps found
- 1
Show comp detail 1 sale within ~0.75 mi
| Address | Dist | Beds/Ba | Sqft | Sold | Price | $/sf | Match |
|---|---|---|---|---|---|---|---|
| 174 North Dr | 0.19mi | 3/1.0 (+1) | 1,609 (+9%) | 6mo | $370,000 | $230 | 64 |
Match score weights: distance 35% · size 25% · config 20% · recency 20%. Top-matched comps best support the ARV.
Projected returns pro-forma
-3.0% appreciation · 3.0% rent growth · sell at horizon
- IRR
- 34.7%
- Equity multiple
- 2.47×
- Total profit
- $41,151
- Equity at exit
- $14,910
- IRR
- 41.6%
- Equity multiple
- 4.93×
- Total profit
- $110,053
- Equity at exit
- $8,646
Cash invested: $28,000 (down + closing). Projections, not guarantees.
Landlord ↔ Tenant lean methodology
- Overall (STATE)
- 15 Strongly Tenant-Friendly
- State New York
- 15 Strongly Tenant-Friendly · D+10
- County
- — inherits STATE
- City
- — inherits STATE
ZIP-level market 12477
- Home prices YoY
- -18.1%
- Active inventory
- 173
- Price-to-rent
- 3.8×
Monthly cashflow live
- Estimated rent
- $2,215 medium interval (Pro) →
- Mortgage (P&I)
- −$524
- Tax from tax record
- −$285 /mo · $3,422/yr
- Insurance
- −$42
- HOA
- −$0
- Vacancy / Maint / Mgmt
- −$465
- Net cashflow
- $898
Break-even live
UW: 25.0% down · 7.5% · 30yr · 1.5% tax · 5.0% vac · 8.0% maint · 8.0% mgmt
Financing live
Cash to close
- Down payment
- $25,000
- Closing costs
- $3,000
- Reserves months
- —
- Total cash needed
- —
Loan-product check · same deal, 3 products live
Conventional
25% down · 7.5% · 30yr
- Down + closing
- —
- Monthly P&I
- —
- Monthly cashflow
- —
- DSCR
- —
- Eligible?
- —
Personal DTI + credit; lowest rate.
DSCR
20% down · 8.5% · 30yr
- Down + closing
- —
- Monthly P&I
- —
- Monthly cashflow
- —
- DSCR
- —
- Eligible?
- —
No personal income docs; deal must DSCR.
Hard money
10% down · 12.0% · 12mo
- Down + closing
- —
- Monthly P&I
- —
- Monthly cashflow
- —
- DSCR
- —
- Eligible?
- —
Short-term bridge; refi at stabilization.
Listing history 18 events
-
2026-06-19days on market $99,999 Active 20 DOM
-
2026-06-18days on market $99,999 Active 19 DOM
-
2026-06-17days on market $99,999 Active 18 DOM
-
2026-06-16days on market $99,999 Active 17 DOM
-
2026-06-15days on market $99,999 Active 16 DOM
-
2026-06-14days on market $99,999 Active 14 DOM
-
2026-06-12days on market $99,999 Active 13 DOM
-
2026-06-09days on market $99,999 Active 10 DOM
-
2026-06-08days on market $99,999 Active 9 DOM
-
2026-06-07days on market $99,999 Active 8 DOM
-
2026-06-03days on market $99,999 Active 4 DOM
-
2026-06-02remarks 693-char remark
-
2026-06-02days on market $99,999 Active 3 DOM
-
2026-06-01days on market $99,999 Active 2 DOM
-
2026-05-30statusdays on market $99,999 Active 1 DOM
-
2026-05-26historical $99,999
-
2001-02-20soldstatus $39,000
-
1979-05-30soldstatus $17,000
ⓘ Source: listings_history table (triggers on properties + properties_extension) + one-shot
backfill from property_details.listing_events for pre-trigger history.
Tax reassessment forecast NY · Partial reset (capped growth)
- Current annual tax
- $3,422 · $285/mo
- Projected year-2 tax
- $3,422 · $285/mo
- Expected delta
- $0/yr ($0/mo · 0.0%)
ⓘ Screening estimate from a state-policy table — verify with the county assessor before closing.
Climate risk First Street
- Flood 5/10 Major FEMA zone X (shaded) · 24% chance over 30 yrs
- Wildfire 3/10 Moderate
- Heat 4/10 Moderate 7 d/yr ≥99°F today · 15 d/yr by 30 yrs out
- Wind 3/10 Moderate 8% chance of damaging wind over 30 yrs
- Air quality 2/10 Low 1 unhealthy d/yr today · 1 by 30 yrs out
Nearby sold comps map
Loading sold comps map…
Walkable amenities ~0.75 mi
Loading nearby amenities…
Taxation est. · year 1
- Rental income
- $26,577
- − Mortgage interest
- −$5,601
- − Property taxes
- −$3,422
- − Insurance
- −$500
- − Repairs & maintenance
- −$2,126
- − Management
- −$2,126
- − Depreciation
- −$2,909
- Taxable income
- $9,893
- Est. tax owed @ 24.0%
- −$2,374
- After-tax cash flow
- $8,407/yr
For passive investors: Depreciation is non-cash, so a rental often shows a tax loss while cash-flowing — sheltering income. Rental losses are passive: they offset passive income freely, and up to $25,000/yr can offset ordinary (W-2) income if you actively participate and your MAGI is under $100k (phasing out to $0 by $150k); unused losses carry forward. On sale, claimed depreciation is recaptured at up to 25%, and gains may owe capital-gains tax (a 1031 exchange can defer both). Figures are a year-1 estimate at your 24.0% rate — not tax advice; consult a CPA.
Schools (NCES district)
- District
- Kingston City School District
- NCES district ID
- 3616290
- Math proficiency
- 44% ▲ 1.00%
- Reading proficiency
- 59% ▲ 20.00%
- Median HH income
- $52,586
- Composite
- 44.22/100
- National rank
- #2849
- State rank
- #355 of 590 in NY
Livability — Ruby
No livability data for this city. (Only ~50 U.S. cities are tracked.)
Census & demographics
- County
- Ulster County · 56,183 people
- City population
- 569
- Metro
- Kingston, NY
- Population (ZIP)
- 19,066
- Household income
- $80,861
- Rent vs Own
- Severe rent burden
- 725.0
Population outlook (Ulster County) Hauer SSP2
- Today (2025)
- 175,887 people
- By 2030
- 171,876 · -2.3%
- By 2040
- 161,771 · -8.0%
- By 2050
- 151,470 · -13.9%
- By 2075
- 133,023 · -24.4%
- By 2100
- 113,504 · -35.5%
Race, ethnicity, and origin ACS 2023
- Neighborhood character
- Predominantly White (82%)
- Race & ethnicity
- White 82% Two or more races 12% Hispanic / Latino 6% Black 1%
- Hispanic origin (detail)
- Puerto Rican 2% Cuban 1%
- Common ancestry
- Romanian 5% Iranian 4% Italian 3%
- Foreign-born
- 4% · Canada
- Languages at home
- 92% English-only · Spanish 4% Other Indo-European 1% German/W. Germanic 1%
Political lean MEDSL · Ulster
- 2024 margin
- D (+18.7) · D 59.3% · R 40.7%
- 2008→2024 swing
- -4.9pp toward R · 2008: 23.6pp · 2024: 18.7pp
- All cycles
- 2024: D+18.7 2020: D+20.9 2016: D+9.1 2012: D+21.9 2008: D+23.6
Not yet ingested
- Civics
- —
Market trends
- HPI YoY
- ▼ -72.47%
- Current HPI
- 327.9975
- Rent YoY
- —
- Metro
- Kingston, NY
- State GDP YoY
- ▲ 2.60%
- F500 in state
- 92
Industry mix (Fortune 500 HQ in NY)
| Industry | F500 HQs | Revenue |
|---|---|---|
| Financial Services | 10 | $950B |
|
||
| Consumer Goods | 9 | $162B |
|
||
| Insurance | 4 | $225B |
|
||
| Telecommunications | 2 | $144B |
|
||
| Pharmaceuticals | 2 | $112B |
|
||
| Media / Entertainment | 2 | $69B |
|
||
Price history
+488.2% since first listed3 events — show timeline
- 2026-05-26 Coming Soon $99,999 OneKey® MLS as Distributed by MLS Grid
- 2001-02-20 Sold (Public Records) $39,000 Public Records
- 1979-05-30 Sold (Public Records) $17,000 Public Records
Property tax history
+2.7%/yrLatest (2025): $3,422 · -0.4% YoY. Source: county tax records.
Cash-flow waterfall
monthlySold comps — $/sqft
last 12 mo · ≤1 miLoading sold comps…