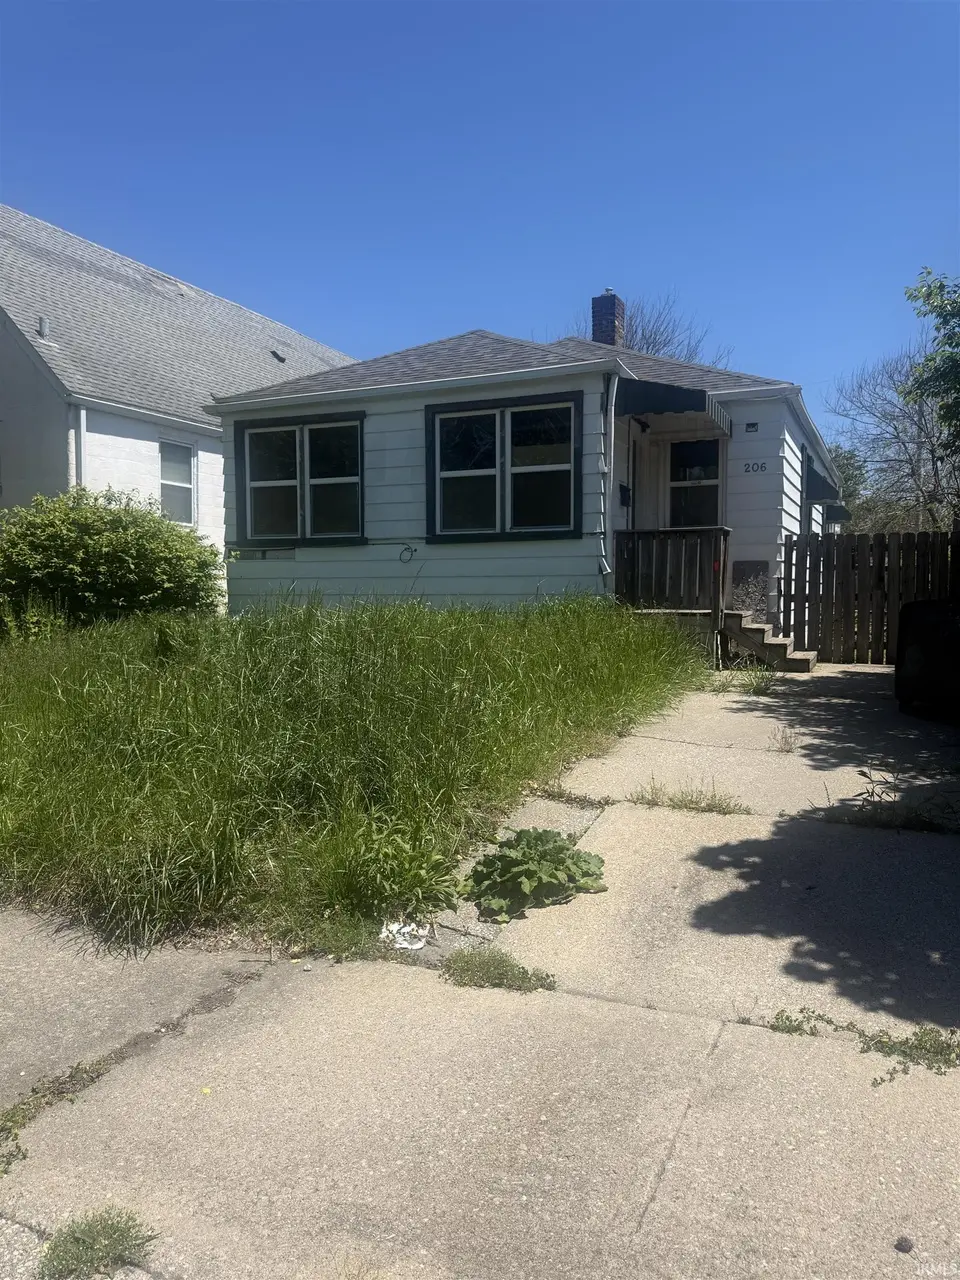
206 S Lake St
South Bend, IN 46619
$55,000B
2 bd · 1.5 ba ·
720 sqft ·
Built 1945
· SingleFamily
· Pending
Cashflow @ list (25.0% down · 7.5%)
Estimated rent
$1,060/mo
Mortgage (P&I)
−$288
Tax + insurance
−$91
HOA
−$0
Vac / Maint / Mgmt
−$223
Net cashflow
$458/mo
Annual
$5,492/yr
Cap rate
16.28%
Cash-on-cash
35.66%
DSCR
2.59
1% rule
1.93%
Cash to close
$15,400
Investor read
- This is a 2-bed/1.5-bath single-family listed at $55k.
- At list price, monthly cash flow is $458 ($5k/yr) — positive.
- The deal already cash-flows at list — no discount required.
- Meets the 1% rule at list price ($1k rent vs $55k).
- Only 0 days on market — expect competitive offers; lowballing is unlikely to land.
- Local home prices are declining (-3.0%/yr); year-one equity from $380 of loan paydown is wiped out by about $2k of value loss. Plan a longer hold.
- Location reads 64/100 on livability (#365 in IN) — a middle-class / working-renter tenant base. Strengths: cost of living A+, housing A+, health & safety A+; Watch: amenities D, employment D, crime F.
- South Bend Community School Corporation (urban): math 12% / reading 21% proficiency, ranked #284 of 301 in IN (top 94%) — low school quality limits family demand, transient renter base, plan for 1-2y turnover; 66% free/reduced lunch — lower-income household profile, screen leases tightly.
- Zoned schools: Harrison Elementary School (math 3% / reading 3%, grade F, #988 of 994 statewide, top 99%, 654 students, 91% FRL); Navarre Middle School (math 0% / reading 4%, grade F, #330 of 330 statewide, top 100%, 519 students, 83% FRL); Washington High School (math 12% / reading 42%, grade F, #315 of 369 statewide, top 86%, 834 students, 79% FRL) — zoned schools average 85% FRL vs 66% district-wide (18 pts higher); higher-poverty schools than district average — tighter screening recommended.
- Watch-outs: built in 1945 — expect roof / HVAC / electrical / plumbing capex.
- Market conditions: 52 active listings in the ZIP; 8 comparable units currently listed for rent nearby; rentals lingering (median 44d on market — plan ~5-8 weeks vacancy on turnover, expect pricing pressure); 62% of comp listings sitting > 30 days — soft ceiling on asking rent; 754 units permitted in St. Joseph County in 2024 (460 in 5+ unit buildings).
- At projected returns (-3.0% appreciation + 3.0% rent growth), your $15k cash investment doubles in ~4 years — after that, you're playing with house money.
- Cap rate 16.3% vs local median 4.4% in South Bend — top-decile yield for the area; either an underpriced asset or a hidden risk that comps aren't pricing in. Stress-test before assuming the spread holds.
Questions for listing agent
- Built in 1945 — when were the roof, HVAC, electrical panel, plumbing, and water heater last replaced?
- Is there a deadline driving the sale (1031 exchange, divorce, estate, relocation)? That informs how much negotiation room exists.
- Schools are F-rated, which usually means shorter tenancies and higher turnover. Who's the typical renter profile here, and what's been the actual vacancy rate?
- Crime grade is F in this area — have there been break-ins, vandalism, or insurance claims at this property in the last 3 years? What carrier currently insures it and at what premium?
- What's the average days-on-market for RENTAL listings here right now (not sales)? A rising rental-DOM trend means longer vacancies and softer asking-rent achievability than the comps imply.
- What's the recent tenant-quality profile in this submarket — average credit score on applications, eviction rate, late-payment / NSF rate, and stable-employment percentage? A property-management company in the area should have these aggregated.
- How much new for-sale + rental construction is in the pipeline within 1–3 miles? Heavy new supply typically softens prices + rents 12–24 months out; constrained supply supports both.
CashFlowRE · CFR-MB03773TP3HW3W
· Data 3 weeks ago
cashflowre.app · 2026-05-29