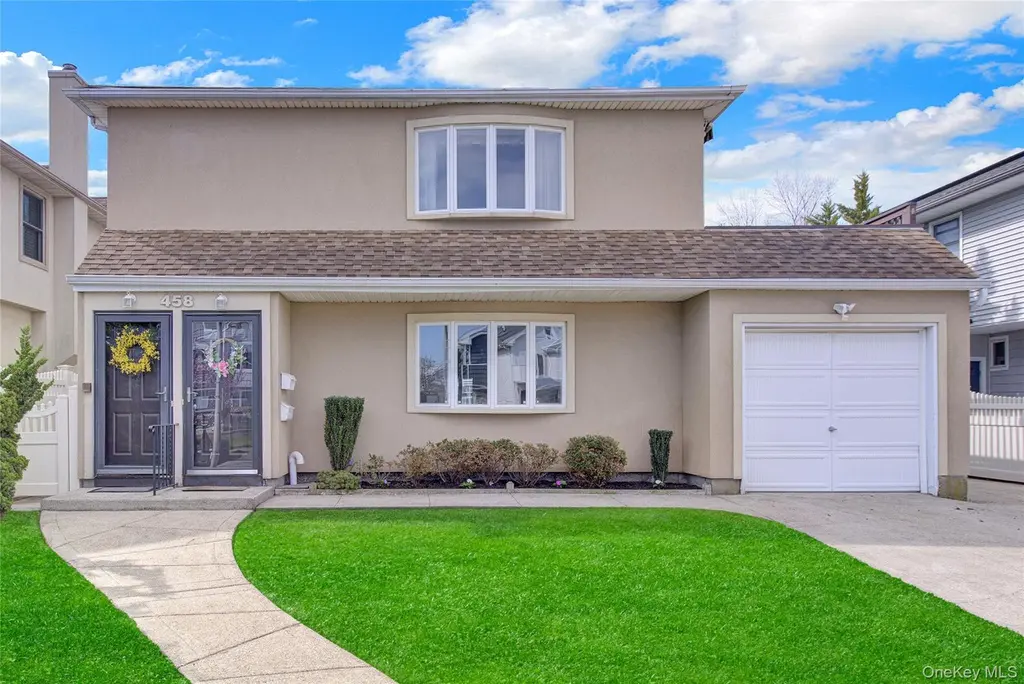
458 E Fulton
Long Beach, NY 11561
$1,299,000D
6 bd · 4.0 ba ·
2,778 sqft ·
Built 1987
· MultiFamily
· Pending
· 27 DOM
Cashflow @ list (25.0% down · 7.5%)
Estimated rent
$8,914/mo
Mortgage (P&I)
−$6,812
Tax + insurance
−$2,276
HOA
−$0
Vac / Maint / Mgmt
−$1,872
Net cashflow
$-2,046/mo
Annual
$-24,558/yr
Cap rate
4.80%
Cash-on-cash
-5.34%
DSCR
0.76
1% rule
0.69%
Cash to close
$363,720
Investor read
- This is a 2 × 3-bed/2-bath units multifamily listed at $1.30M.
- At list price, monthly cash flow is $-2k ($-25k/yr) — negative. Per door: $-1k/mo.
- To cash-flow at today's rent, offer at most $937k (27.8% below list).
- To meet the 1% rule (rent ≥ 1% of price), the offer needs to be $891k (31.4% below list).
- It's been on market 27 days — a 2% lower offer ($1.28M) is reasonable based on typical stale-listing flexibility.
- Recommended offer: $891k (31.4% below list) — sets the bar for 1% rule.
- Local home prices are declining (-3.0%/yr); year-one equity from $9k of loan paydown is wiped out by about $39k of value loss. Plan a longer hold.
- Location reads 82/100 on livability (#84 in NY, #1,285 nationally) — a professional / high-income tenant draw. Strengths: schools A+, crime A+, commute A+; Watch: cost of living F.
- Long Beach City School District (suburban): math 66% / reading 65% proficiency, ranked #150 of 590 in NY (top 25%) — acceptable for families but not a draw, mixed tenant base, ~2y average lease.
- Watch-outs: flood insurance adds $427/mo.
- Market conditions: Rents rising fast (+4.8%/yr); 352 active listings in the ZIP; 1 comparable units currently listed for rent nearby; high-income renter base; 824 units permitted in Nassau County in 2024 (153 in 5+ unit buildings).
- Nassau County population projected at +7% by 2050 — modest demand growth; plan on rents tracking national, not racing it.
- Current owner paid $330k; list at $1.30M implies a 294% gain — meaningful room to come down on a strong offer.
- Climate carrying-cost: in FEMA flood zone AE (mandatory federal flood insurance); severe wind risk, 80% chance of damaging wind over 30y; extreme-heat days projected 7→17/yr by 2055 (HVAC capex compounding) — expect insurance premiums to compound above CPI over the hold.
- Cap rate 4.8% vs local median 2.1% in Long Beach — top-decile yield for the area; either an underpriced asset or a hidden risk that comps aren't pricing in. Stress-test before assuming the spread holds.
- At $8,914/mo this rent would consume 76% of the median local household income ($142k/yr) (locally 1284% of renters already pay >50% of income on rent) — very limited rent-growth headroom before tenants either downsize or default.
Questions for listing agent
- What do current leases actually rent for vs. the listed asking? Can we see a recent rent roll and the last 12 months of T-12 income?
- Can we see the unit-by-unit rent roll, current vacancy, and any below-market leases? What's the average tenancy length?
- What capital expenditures (roof, boiler, parking lot, exteriors) have been made in the last 5 years, and what's planned in the next 2?
- What's the actual annual flood-insurance premium (NFIP or private), and is the property in a SFHA with mandatory coverage?
- Is there a deadline driving the sale (1031 exchange, divorce, estate, relocation)? That informs how much negotiation room exists.
- Schools are A-rated — typically a magnet for longer-tenancy family renters. What's the average tenant stay here, and is there a school-zone premium baked into asking?
- The area grade is low — what's the realistic commute time and amenity access for the typical tenant pool here? Any planned neighborhood developments (good or bad) we should know about?
- What's the average days-on-market for RENTAL listings here right now (not sales)? A rising rental-DOM trend means longer vacancies and softer asking-rent achievability than the comps imply.
CashFlowRE · CFR-MB4SW08E2RWNR3
· Data 3 weeks ago
cashflowre.app · 2026-05-29