 Duplex
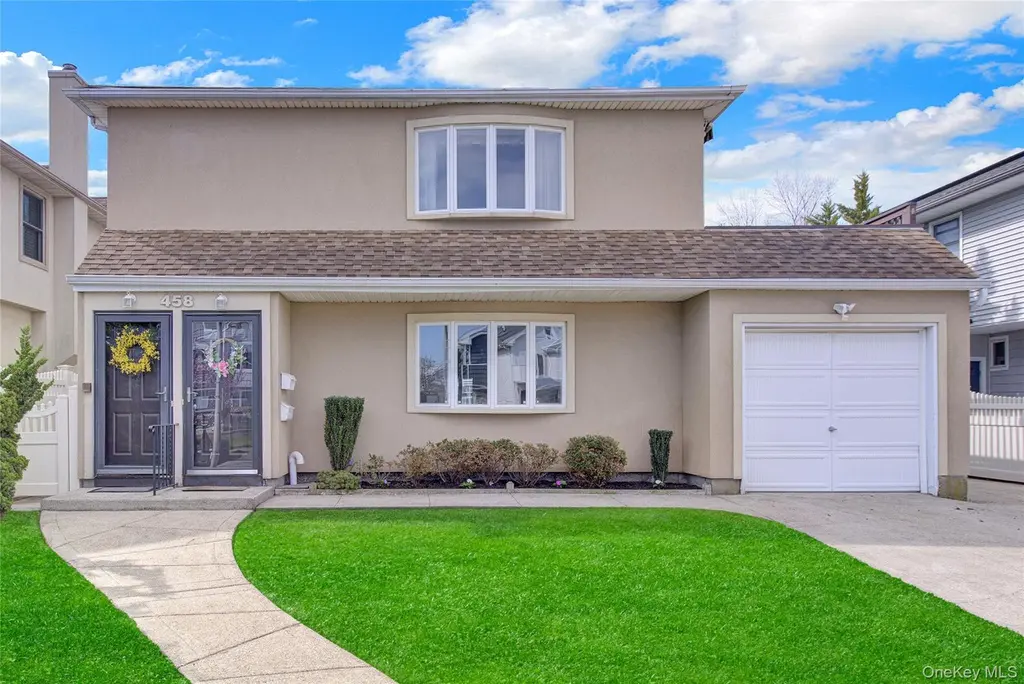
458 E Fulton · Long Beach, NY
Flood risk 7/10 · Major
- FEMA flood zone
- AE
- Chance of flooding over 30 yrs
- 0.86%
- Est. flood insurance / yr
- $1,737 – $8,500
Fire risk 1/10 · Minimal
- Est. fire insurance / yr
- $691 – $1,283
Heat risk 6/10 · Moderate
- Hot days now (above 95°F)
- 7 days/yr
- Hot days in 30 yrs
- 17 days/yr
Wind risk 8/10 · Major
- Chance of severe wind over 30 yrs
- 80.0%
Air-quality risk 4/10 · Minor
- Unhealthy air days now
- 4 days/yr
- Unhealthy air days in 30 yrs
- 6 days/yr
Risk factors via First Street. Map © Google.
Why this score? — see what drove the D grade
The composite is a weighted blend of 9 inputs, each scored 0–100. Each bar is that input's sub-score; the figure is the points it added to the 100-point composite (weight × sub-score).
- ARV discount +13.0/15.0
- Cash flow +7.5/30.0
- Schools +5.9/10.0
- Livability +4.1/5.0
- Rent growth +3.7/5.0
- Condition / age +2.5/5.0
- 1% rule +1.9/10.0
- DSCR +1.6/10.0
- Appreciation +0.0/10.0
$1,299,000
🖨 Deal sheet 📄 Offer letter ✓ Due diligence
Multi-family units
County records classify this as Multi-Family (2-4 Unit). Listing-text estimate: 2 units. confirmed
Listing remarks MLS
"JUST LISTED" Custom built legal two (2) with two identical apartments. Each unit has three bedrooms, 2 baths, living room, dining room, and an eat in kitchen. Each unit has its own washer and dryer and separate heating units. Upstairs has central air and a porch facing west. Besides a garage there is off street parking for 3-4 cars. Both units have an updated kitchen. There is a lovely backyard for entertaining. THIS IS A MUST SEE
Key facts
- Porch facing west
- Identical apartments
- Garage
Tags
Neighborhood map
What this means for you Summary
Snapshot
- This is a 2 × 3-bed/2-bath units multifamily listed at $1.30M.
Deal economics
- At list price, monthly cash flow is $-2k ($-25k/yr) — negative. Per door: $-1k/mo.
- To cash-flow at today's rent, offer at most $937k (27.8% below list).
- To meet the 1% rule (rent ≥ 1% of price), the offer needs to be $891k (31.4% below list).
- Recommended offer: $891k (31.4% below list) — sets the bar for 1% rule.
- Cap rate 4.8% vs local median 2.1% in Long Beach — top-decile yield for the area; either an underpriced asset or a hidden risk that comps aren't pricing in. Stress-test before assuming the spread holds.
Location & tenants
- Location reads 82/100 on livability (#84 in NY, #1,285 nationally) — a professional / high-income tenant draw. Strengths: schools A+, crime A+, commute A+; Watch: cost of living F.
- Long Beach City School District (suburban): math 66% / reading 65% proficiency, ranked #150 of 590 in NY (top 25%) — acceptable for families but not a draw, mixed tenant base, ~2y average lease.
- Market conditions: Rents rising fast (+4.8%/yr); 352 active listings in the ZIP; 1 comparable units currently listed for rent nearby; high-income renter base; 824 units permitted in Nassau County in 2024 (153 in 5+ unit buildings).
- At $8,914/mo this rent would consume 76% of the median local household income ($142k/yr) (locally 1284% of renters already pay >50% of income on rent) — very limited rent-growth headroom before tenants either downsize or default.
Forward outlook
- Local home prices are declining (-3.0%/yr); year-one equity from $9k of loan paydown is wiped out by about $39k of value loss. Plan a longer hold.
- Nassau County population projected at +7% by 2050 — modest demand growth; plan on rents tracking national, not racing it.
Negotiation context
- It's been on market 27 days — a 2% lower offer ($1.28M) is reasonable based on typical stale-listing flexibility.
- Current owner paid $330k; list at $1.30M implies a 294% gain — meaningful room to come down on a strong offer.
Risks & watch-outs
- Watch-outs: flood insurance adds $427/mo.
- Climate carrying-cost: in FEMA flood zone AE (mandatory federal flood insurance); severe wind risk, 80% chance of damaging wind over 30y; extreme-heat days projected 7→17/yr by 2055 (HVAC capex compounding) — expect insurance premiums to compound above CPI over the hold.
Questions for the listing agent
- What do current leases actually rent for vs. the listed asking? Can we see a recent rent roll and the last 12 months of T-12 income?
- Can we see the unit-by-unit rent roll, current vacancy, and any below-market leases? What's the average tenancy length?
- What capital expenditures (roof, boiler, parking lot, exteriors) have been made in the last 5 years, and what's planned in the next 2?
- What's the actual annual flood-insurance premium (NFIP or private), and is the property in a SFHA with mandatory coverage?
- Is there a deadline driving the sale (1031 exchange, divorce, estate, relocation)? That informs how much negotiation room exists.
- Schools are A-rated — typically a magnet for longer-tenancy family renters. What's the average tenant stay here, and is there a school-zone premium baked into asking?
- The area grade is low — what's the realistic commute time and amenity access for the typical tenant pool here? Any planned neighborhood developments (good or bad) we should know about?
- What's the average days-on-market for RENTAL listings here right now (not sales)? A rising rental-DOM trend means longer vacancies and softer asking-rent achievability than the comps imply.
- What's the recent tenant-quality profile in this submarket — average credit score on applications, eviction rate, late-payment / NSF rate, and stable-employment percentage? A property-management company in the area should have these aggregated.
- How much new apartment / multifamily construction is in the pipeline within 1–3 miles? Heavy new supply (>2% of stock underway) typically softens rents 12–24 months out; light construction supports rent growth.
Investment metrics
- 1% rule
- 0.69% ✗
- Cap rate
- 4.80%
- Cash-on-cash
- -5.34%
- DSCR
- 0.76
- GRM
- 12.1
CMA / ARV
- ARV (median comp)
- $1,480,562
- List price
- $1,299,000
- Delta
- -12.26%
- Verdict
- UNDERPRICED
- Comps
- 20 within 1.0 mi
Show comp detail 6 sales within ~0.75 mi
| Address | Dist | Beds/Ba | Sqft | Sold | Price | $/sf | Match |
|---|---|---|---|---|---|---|---|
| 429 E Park Ave | 0.18mi | 5/3.0 (-1) | 2,791 (+0%) | 8mo | $975,000 | $349 | 75 |
| 272 E Harrison St | 0.31mi | 5/3.0 (-1) | 2,710 (-2%) | 4mo | $950,000 | $351 | 69 |
| 725 E Broadway | 0.60mi | 6/4.0 | 2,870 (+3%) | 8mo | $1,588,000 | $553 | 60 |
| 615 E Olive St | 0.37mi | 5/4.0 (-1) | 2,979 (+7%) | 8mo | $935,000 | $314 | 59 |
| 318 E Olive St | 0.39mi | 6/4.0 | 3,192 (+15%) | 7mo | $1,250,000 | $392 | 51 |
| 565 E Hudson St | 0.16mi | 5/3.0 (-1) | 2,407 (-13%) | 12mo | $999,000 | $415 | 51 |
Match score weights: distance 35% · size 25% · config 20% · recency 20%. Top-matched comps best support the ARV.
Projected returns pro-forma
-3.0% appreciation · 4.84% rent growth · sell at horizon
- IRR
- -25.9%
- Equity multiple
- 0.11×
- Total profit
- $-323,828
- Equity at exit
- $193,685
- IRR
- -17.6%
- Equity multiple
- -0.04×
- Total profit
- $-377,392
- Equity at exit
- $112,314
Cash invested: $363,720 (down + closing). Projections, not guarantees.
Landlord ↔ Tenant lean methodology
- Overall (STATE)
- 15 Strongly Tenant-Friendly
- State New York
- 15 Strongly Tenant-Friendly · D+10
- County
- — inherits STATE
- City
- — inherits STATE
ZIP-level market 11561
- Rents YoY
- 4.8%
- Active inventory
- 352
- Price-to-rent
- 24.3×
Monthly cashflow live
- Estimated rent
- $8,914 high interval (Pro) →
- Mortgage (P&I)
- −$6,812
- Tax from tax record
- −$1,309 /mo · $15,704/yr
- Insurance
- −$541
- Flood insurance flood zone
- −$427 /mo · $5,118/yr
- HOA
- −$0
- Vacancy / Maint / Mgmt
- −$1,872
- Net cashflow
- $-2,046
Break-even live
2-unit breakdown (identical units grouped — click to expand)
| Units | Beds | Baths | Est. rent |
|---|---|---|---|
| 2× units | 3 | 2 | $8,914 |
| #1 | 3 | 2 | $4,457 |
| #2 | 3 | 2 | $4,457 |
| Total (2 units) | $8,914 | ||
UW: 25.0% down · 7.5% · 30yr · 1.5% tax · 5.0% vac · 8.0% maint · 8.0% mgmt
Financing live
Cash to close
- Down payment
- $324,750
- Closing costs
- $38,970
- Reserves months
- —
- Total cash needed
- —
Loan-product check · same deal, 3 products live
Conventional
25% down · 7.5% · 30yr
- Down + closing
- —
- Monthly P&I
- —
- Monthly cashflow
- —
- DSCR
- —
- Eligible?
- —
Personal DTI + credit; lowest rate.
DSCR
20% down · 8.5% · 30yr
- Down + closing
- —
- Monthly P&I
- —
- Monthly cashflow
- —
- DSCR
- —
- Eligible?
- —
No personal income docs; deal must DSCR.
Hard money
10% down · 12.0% · 12mo
- Down + closing
- —
- Monthly P&I
- —
- Monthly cashflow
- —
- DSCR
- —
- Eligible?
- —
Short-term bridge; refi at stabilization.
Rent comps 1 comps
| Address | Beds | Baths | Sqft | Rent | $/sqft | DOM | Units | Dist |
|---|---|---|---|---|---|---|---|---|
| 302 W Hudson St Long Beach, NY | 6.0 | 2.0 | 2000 | $6,500 | $3.25 | 19d | 1 | 1.21mi |
Listing history 3 events
-
2026-05-11status Pending 446-char remark
Show marketing remark (446 chars)
"JUST LISTED" Custom built legal two (2) with two identical apartments. Each unit has three bedrooms, 2 baths, living room, dining room, and an eat in kitchen. Each unit has its own washer and dryer and separate heating units. Upstairs has central air and a porch facing west. Besides a garage there is off street parking for 3-4 cars. Both units have an updated kitchen. There is a lovely backyard for entertaining. THIS IS A MUST SEE
-
2026-04-14$1,299,000 Active 446-char remark
Show marketing remark (446 chars)
"JUST LISTED" Custom built legal two (2) with two identical apartments. Each unit has three bedrooms, 2 baths, living room, dining room, and an eat in kitchen. Each unit has its own washer and dryer and separate heating units. Upstairs has central air and a porch facing west. Besides a garage there is off street parking for 3-4 cars. Both units have an updated kitchen. There is a lovely backyard for entertaining. THIS IS A MUST SEE
-
1988-01-29soldstatus $330,000
ⓘ Source: listings_history table (triggers on properties + properties_extension) + one-shot
backfill from property_details.listing_events for pre-trigger history.
Tax reassessment forecast NY · Partial reset (capped growth)
- Current annual tax
- $15,704 · $1,309/mo
- Projected year-2 tax
- $18,828 · $1,569/mo
- Expected delta
- +$3,125/yr (+$260/mo · 19.9%)
ⓘ Screening estimate from a state-policy table — verify with the county assessor before closing.
Climate risk First Street
- Flood 7/10 Severe FEMA zone AE · 86% chance over 30 yrs
- Wildfire 1/10 Low
- Heat 6/10 Major 7 d/yr ≥95°F today · 17 d/yr by 30 yrs out
- Wind 8/10 Severe 80% chance of damaging wind over 30 yrs
- Air quality 4/10 Moderate 4 unhealthy d/yr today · 6 by 30 yrs out
Nearby sold comps map
Loading sold comps map…
Walkable amenities ~0.75 mi
Loading nearby amenities…
Taxation est. · year 1
- Rental income
- $106,968
- − Mortgage interest
- −$72,764
- − Property taxes
- −$15,704
- − Insurance
- −$11,614
- − Repairs & maintenance
- −$8,557
- − Management
- −$8,557
- − Depreciation
- −$37,789
- Taxable loss
- −$48,018
- Est. tax savings @ 24.0%
- +$11,524
- After-tax cash flow
- $-13,034/yr
For passive investors: Depreciation is non-cash, so a rental often shows a tax loss while cash-flowing — sheltering income. Rental losses are passive: they offset passive income freely, and up to $25,000/yr can offset ordinary (W-2) income if you actively participate and your MAGI is under $100k (phasing out to $0 by $150k); unused losses carry forward. On sale, claimed depreciation is recaptured at up to 25%, and gains may owe capital-gains tax (a 1031 exchange can defer both). Figures are a year-1 estimate at your 24.0% rate — not tax advice; consult a CPA.
Schools (NCES district)
- District
- Long Beach City School District
- NCES district ID
- 3617730
- Math proficiency
- 66% ▼ -6.00%
- Reading proficiency
- 65% ▼ -1.00%
- Median HH income
- $86,938
- Composite
- 59.18/100
- National rank
- #947
- State rank
- #150 of 590 in NY
Livability — Long Beach
- Score
- 82/100
- State rank
- #84
- US rank
- #1285
Category grades
Schools grade is shown separately in the Schools card above.
Census & demographics
- Census place
- Long Beach, NY
- County
- Nassau County · 653,051 people
- City population
- 38,708
- Metro
- New York-Newark-Jersey City, NY-NJ-PA
- Population (ZIP)
- 38,708
- Household income
- $141,629
- Rent vs Own
- Severe rent burden
- 1284.0
Population outlook (Nassau County) Hauer SSP2
- Today (2025)
- 1,409,302 people
- By 2030
- 1,431,482 · +1.6%
- By 2040
- 1,471,607 · +4.4%
- By 2050
- 1,502,845 · +6.6%
- By 2075
- 1,575,403 · +11.8%
- By 2100
- 1,554,356 · +10.3%
Race, ethnicity, and origin ACS 2023
- Neighborhood character
- Predominantly White (73%)
- Race & ethnicity
- White 73% Hispanic / Latino 14% Two or more races 7% Asian 5% Black 4%
- Hispanic origin (detail)
- Puerto Rican 2% Dominican 1%
- Common ancestry
- Romanian 4% Scotch-Irish 4% Italian 2%
- Foreign-born
- 14% · Canada, Jamaica, China
- Languages at home
- 84% English-only · Spanish 8% Other Indo-European 3% Tagalog/Filipino 2%
Political lean MEDSL · Nassau
- 2024 margin
- Toss-up / Even · D 47.9% · R 52.1%
- 2008→2024 swing
- -12.6pp toward R · 2008: 8.4pp · 2024: -4.2pp
- All cycles
- 2024: R+4.2 2020: D+9.5 2016: D+5.3 2012: D+6.7 2008: D+8.4
Not yet ingested
- Civics
- —
Market trends
- HPI YoY
- ▼ -1067.69%
- Current HPI
- 309.3598
- Rent YoY
- ▲ 4.84%
- Metro
- New York-Newark-Jersey City, NY-NJ-PA
- State GDP YoY
- ▲ 2.60%
- F500 in state
- 92
Industry mix (Fortune 500 HQ in NY)
| Industry | F500 HQs | Revenue |
|---|---|---|
| Financial Services | 10 | $950B |
|
||
| Consumer Goods | 9 | $162B |
|
||
| Insurance | 4 | $225B |
|
||
| Telecommunications | 2 | $144B |
|
||
| Pharmaceuticals | 2 | $112B |
|
||
| Media / Entertainment | 2 | $69B |
|
||
Price history
+293.6% since first listed3 events — show timeline
- 2026-05-11 Pending — OneKey® MLS as Distributed by MLS Grid
- 2026-04-14 Listed $1,299,000 OneKey® MLS as Distributed by MLS Grid
- 1988-01-29 Sold (Public Records) $330,000 Public Records
Property tax history
+6.1%/yrLatest (2024): $15,704 · +1.3% YoY. Source: county tax records.
Cash-flow waterfall
monthlySold comps — $/sqft
last 12 mo · ≤1 miLoading sold comps…