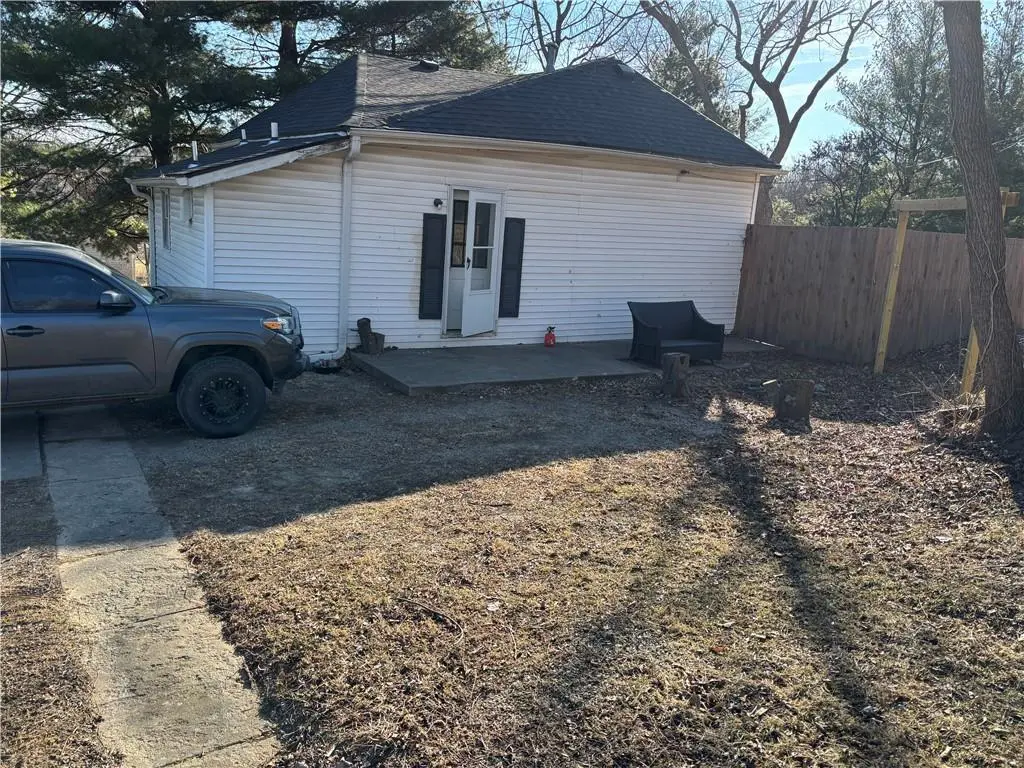
4502 Orchard Rd
St. Joseph, MO 64506
$119,900D+
2 bd · 1.0 ba ·
877 sqft ·
Built 1927
· SingleFamily
· Active
· 132 DOM
Cashflow @ list (25.0% down · 7.5%)
Estimated rent
$955/mo
Mortgage (P&I)
−$629
Tax + insurance
−$110
HOA
−$0
Vac / Maint / Mgmt
−$201
Net cashflow
$16/mo
Annual
$192/yr
Cap rate
6.45%
Cash-on-cash
0.57%
DSCR
1.03
1% rule
0.80%
Cash to close
$33,572
Investor read
- This is a 2-bed/1.0-bath single-family listed at $120k.
- At list price, monthly cash flow is $16 ($192/yr) — positive.
- The deal already cash-flows at list — no discount required.
- To meet the 1% rule (rent ≥ 1% of price), the offer needs to be $96k (20.3% below list).
- It's been on market 132 days — a 12% lower offer ($106k) is reasonable based on typical stale-listing flexibility.
- Recommended offer: $96k (20.3% below list) — sets the bar for 1% rule.
- Local home prices are declining (-3.0%/yr); year-one equity from $829 of loan paydown is wiped out by about $4k of value loss. Plan a longer hold.
- Location reads: area grade D — affects rentability + tenant quality, not the cash-flow math above.
- St. Joseph (urban): math 28% / reading 38% proficiency, ranked #241 of 324 in MO (top 74%) — families likely to look elsewhere, expect single-tenant / working-renter base with shorter leases.
- Watch-outs: built in 1927 — expect roof / HVAC / electrical / plumbing capex.
- Market conditions: 119 active listings in the ZIP; 1 comparable units currently listed for rent nearby; 70 units permitted in Buchanan County in 2024 (0 in 5+ unit buildings).
- Buchanan County population projected to shrink 6% by 2050 — rents likely to lag national; underwrite the cash flow, not the appreciation.
- 4 sale attempts since 3y ago with the ask held roughly flat each time — persistent listings suggest the price (not the market) is what's stuck; bring a comps-based counter.
- Cap rate 6.5% vs local median 4.7% in St. Joseph — top-decile yield for the area; either an underpriced asset or a hidden risk that comps aren't pricing in. Stress-test before assuming the spread holds.
- This rent is only 17% of the median local income ($66k/yr) — well below the 30% rent-burden line; pricing power to push rent on renewal without tenant pushback.
Questions for listing agent
- It's been on market 132 days. Have you received any prior offers? Is the seller open to a 20% concession, seller financing, or rate buy-down credit?
- Built in 1927 — when were the roof, HVAC, electrical panel, plumbing, and water heater last replaced?
- Why hasn't it sold? Are there any deal-killer items the seller is aware of (foundation, flood, title, zoning, code violations)?
- Is there a deadline driving the sale (1031 exchange, divorce, estate, relocation)? That informs how much negotiation room exists.
- The area grade is low — what's the realistic commute time and amenity access for the typical tenant pool here? Any planned neighborhood developments (good or bad) we should know about?
- What's the average days-on-market for RENTAL listings here right now (not sales)? A rising rental-DOM trend means longer vacancies and softer asking-rent achievability than the comps imply.
- What's the recent tenant-quality profile in this submarket — average credit score on applications, eviction rate, late-payment / NSF rate, and stable-employment percentage? A property-management company in the area should have these aggregated.
- How much new for-sale + rental construction is in the pipeline within 1–3 miles? Heavy new supply typically softens prices + rents 12–24 months out; constrained supply supports both.
CashFlowRE · CFR-MCG49ZCDRAYHCA
· Data 1 day ago
cashflowre.app · 2026-05-29