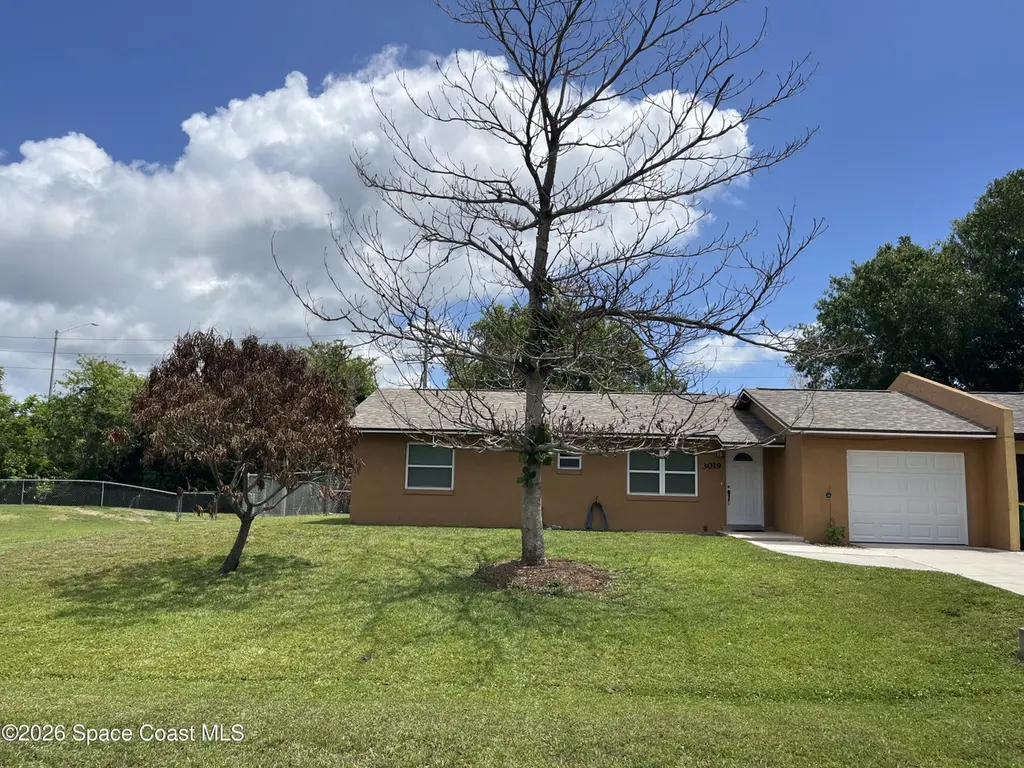
3019 Sea Gate Cir
North Merritt Island, FL 32953
$257,000D-
2 bd · 2.0 ba ·
1,110 sqft ·
Built 1984
· SingleFamily
· Active
· 53 DOM
Cashflow @ list (25.0% down · 7.5%)
Estimated rent
$2,078/mo
Mortgage (P&I)
−$1,348
Tax + insurance
−$340
HOA
−$0
Vac / Maint / Mgmt
−$436
Net cashflow
$-46/mo
Annual
$-554/yr
Cap rate
6.08%
Cash-on-cash
-0.77%
DSCR
0.97
1% rule
0.81%
Cash to close
$71,960
Investor read
- This is a 2-bed/2.0-bath single-family listed at $257k.
- At list price, monthly cash flow is $-46 ($-554/yr) — negative.
- To cash-flow at today's rent, offer at most $249k (3.2% below list).
- To meet the 1% rule (rent ≥ 1% of price), the offer needs to be $208k (19.1% below list).
- It's been on market 53 days — a 3% lower offer ($249k) is reasonable based on typical stale-listing flexibility.
- Recommended offer: $208k (19.1% below list) — sets the bar for 1% rule.
- Local home prices are declining (-3.0%/yr); year-one equity from $2k of loan paydown is wiped out by about $8k of value loss. Plan a longer hold.
- Location reads: area grade D — affects rentability + tenant quality, not the cash-flow math above.
- Brevard (suburban): math 53% / reading 57% proficiency, ranked #19 of 73 in FL (top 26%) — acceptable for families but not a draw, mixed tenant base, ~2y average lease.
- Zoned schools: Lewis Carroll Elementary School (math 72% / reading 70%, grade A-, #320 of 2,144 statewide, top 15%, 626 students, 38% FRL); Thomas Jefferson Middle School (math 63% / reading 55%, grade B, #144 of 571 statewide, top 26%, 608 students, 43% FRL); Merritt Island High School (math 32% / reading 55%, grade F, #248 of 667 statewide, top 38%, 1,546 students, 35% FRL) — zoned schools at 39% FRL track the district average.
- Market conditions: Rents rising (+2.1%/yr); 221 active listings in the ZIP; 6 comparable units currently listed for rent nearby; rentals at typical pace (median 26d on market — plan ~3-4 weeks tenant-placement turnaround); solid renter incomes; 4,602 units permitted in Brevard County in 2024 (702 in 5+ unit buildings).
- Brevard County population projected at +15% by 2050 — modest demand growth; plan on rents tracking national, not racing it.
- 4 sale attempts since 21y ago; this cycle's ask has dropped $16k (6%) from the opening price — seller is motivated, your offer sets the floor, not the list.
- Current owner paid $50k; list at $257k implies a 414% gain — meaningful room to come down on a strong offer.
- Climate carrying-cost: major flood risk; severe wind risk, 99% chance of damaging wind over 30y; extreme-heat days projected 7→23/yr by 2055 (HVAC capex compounding) — expect insurance premiums to compound above CPI over the hold.
Questions for listing agent
- What do current leases actually rent for vs. the listed asking? Can we see a recent rent roll and the last 12 months of T-12 income?
- It's been on market 53 days. Have you received any prior offers? Is the seller open to a 19% concession, seller financing, or rate buy-down credit?
- Is there a deadline driving the sale (1031 exchange, divorce, estate, relocation)? That informs how much negotiation room exists.
- The area grade is low — what's the realistic commute time and amenity access for the typical tenant pool here? Any planned neighborhood developments (good or bad) we should know about?
- What's the average days-on-market for RENTAL listings here right now (not sales)? A rising rental-DOM trend means longer vacancies and softer asking-rent achievability than the comps imply.
- What's the recent tenant-quality profile in this submarket — average credit score on applications, eviction rate, late-payment / NSF rate, and stable-employment percentage? A property-management company in the area should have these aggregated.
- How much new for-sale + rental construction is in the pipeline within 1–3 miles? Heavy new supply typically softens prices + rents 12–24 months out; constrained supply supports both.
CashFlowRE · CFR-MCXGM26HFZZ0XN
· Data 19 h ago
cashflowre.app · 2026-05-29