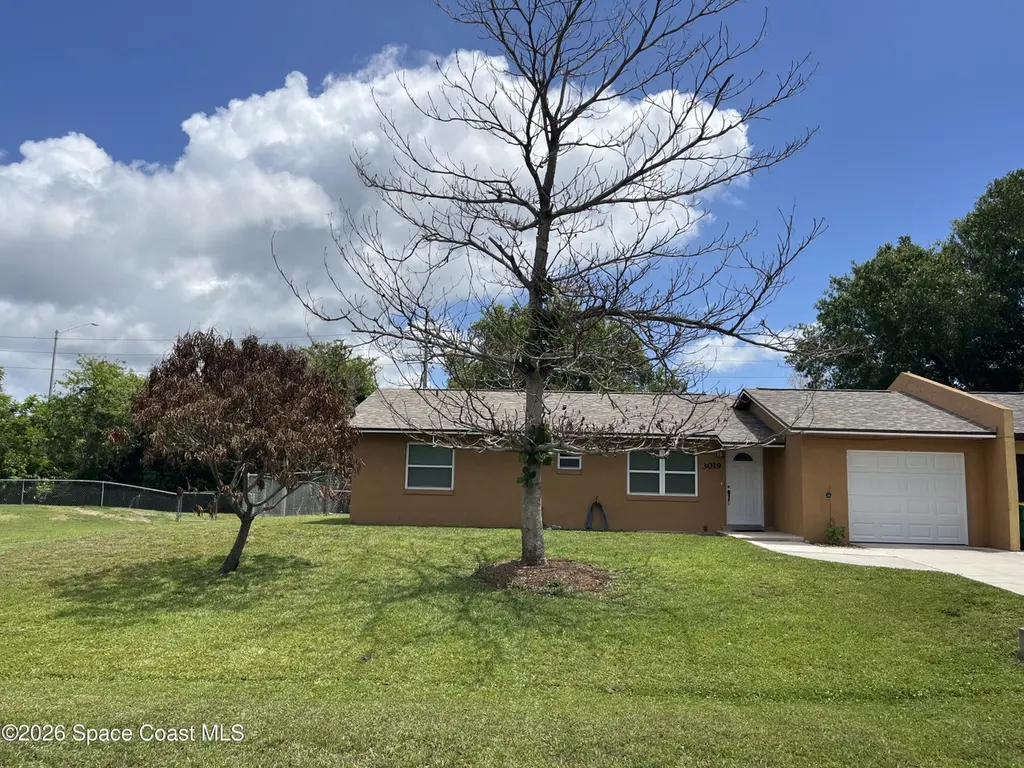
3019 Sea Gate Cir · North Merritt Island, FL
Flood risk 6/10 · Moderate
- FEMA flood zone
- X (unshaded)
- Chance of flooding over 30 yrs
- 0.54%
- Est. flood insurance / yr
- $507 – $1,088
Fire risk 3/10 · Minor
- Est. fire insurance / yr
- $947 – $1,759
Heat risk 10/10 · Severe
- Hot days now (above 105°F)
- 7 days/yr
- Hot days in 30 yrs
- 23 days/yr
Wind risk 10/10 · Severe
- Chance of severe wind over 30 yrs
- 99.0%
Air-quality risk 1/10 · Minimal
- Unhealthy air days now
- 0 days/yr
- Unhealthy air days in 30 yrs
- 0 days/yr
Risk factors via First Street. Map © Google.
Why this score? — see what drove the D- grade
The composite is a weighted blend of 9 inputs, each scored 0–100. Each bar is that input's sub-score; the figure is the points it added to the 100-point composite (weight × sub-score).
- Cash flow +12.3/30.0
- ARV discount +7.5/15.0
- Schools +4.7/10.0
- DSCR +3.7/10.0
- 1% rule +3.1/10.0
- Rent growth +3.0/5.0
- Livability +2.5/5.0
- Condition / age +2.5/5.0
- Appreciation +0.0/10.0
$257,000
🖨 Deal sheet (PDF) 📄 Offer letter ✓ Due diligence
Listing remarks MLS
Nicely updated with a new kitchenw/ tiled countertops, tiled and laminate wood floors, updated bath vanities, painted in designer colors, roof replaced in 2003,A/C replaced in 2001, large lot fenced, beautiful oak trees.
Key facts
- Open floor plan
- Laminate wood floors
- Fenced back yard
Tags
Property features AI
Exterior
- Parking: Attached garage with garage door opener (1 car)
- Utilities: Public sewer and septic tank; Cable available; Electricity connected; Sewer connected
- Home design: Single family residence; One story; Entry level: One
- Construction: Block and stucco construction; Shingle roof; Pets allowed
- Exterior features: Patio; Chain link and wood fencing; Faces west; County road frontage; Asphalt road surface; Lot features: Other
Interior
- Kitchen: Dishwasher; Electric oven; Microwave; Refrigerator
- Bedrooms: 2 bedrooms
- Flooring: Laminate; Tile
- Bathrooms: 2 full bathrooms
- Heating & cooling: Central heating (electric); Central air conditioning (electric)
- Interior features: Breakfast bar; Ceiling fan(s); Primary bathroom with shower (no tub)
- Laundry & utility: Washer hookup; Electric dryer hookup; Laundry area in garage
Neighborhood map
What this means for you Summary
Snapshot
- This is a 2-bed/2.0-bath single-family listed at $257k.
Deal economics
- At list price, monthly cash flow is $-46 ($-554/yr) — negative.
- To cash-flow at today's rent, offer at most $249k (3.2% below list).
- To meet the 1% rule (rent ≥ 1% of price), the offer needs to be $208k (19.1% below list).
- Recommended offer: $208k (19.1% below list) — sets the bar for 1% rule.
Location & tenants
- Location reads: area grade D — affects rentability + tenant quality, not the cash-flow math above.
- Brevard (suburban): math 53% / reading 57% proficiency, ranked #19 of 73 in FL (top 26%) — acceptable for families but not a draw, mixed tenant base, ~2y average lease.
- Zoned schools: Lewis Carroll Elementary School (math 72% / reading 70%, grade A-, #320 of 2,144 statewide, top 15%, 626 students, 38% FRL); Thomas Jefferson Middle School (math 63% / reading 55%, grade B, #144 of 571 statewide, top 26%, 608 students, 43% FRL); Merritt Island High School (math 32% / reading 55%, grade F, #248 of 667 statewide, top 38%, 1,546 students, 35% FRL) — zoned schools at 39% FRL track the district average.
- Market conditions: Rents rising (+2.1%/yr); 221 active listings in the ZIP; 6 comparable units currently listed for rent nearby; rentals at typical pace (median 26d on market — plan ~3-4 weeks tenant-placement turnaround); solid renter incomes; 4,602 units permitted in Brevard County in 2024 (702 in 5+ unit buildings).
Forward outlook
- Local home prices are declining (-3.0%/yr); year-one equity from $2k of loan paydown is wiped out by about $8k of value loss. Plan a longer hold.
- Brevard County population projected at +15% by 2050 — modest demand growth; plan on rents tracking national, not racing it.
Negotiation context
- It's been on market 53 days — a 3% lower offer ($249k) is reasonable based on typical stale-listing flexibility.
- 4 sale attempts since 21y ago; this cycle's ask has dropped $16k (6%) from the opening price — seller is motivated, your offer sets the floor, not the list.
- Current owner paid $50k; list at $257k implies a 414% gain — meaningful room to come down on a strong offer.
Risks & watch-outs
- Climate carrying-cost: major flood risk; severe wind risk, 99% chance of damaging wind over 30y; extreme-heat days projected 7→23/yr by 2055 (HVAC capex compounding) — expect insurance premiums to compound above CPI over the hold.
Questions for the listing agent
- What do current leases actually rent for vs. the listed asking? Can we see a recent rent roll and the last 12 months of T-12 income?
- It's been on market 53 days. Have you received any prior offers? Is the seller open to a 19% concession, seller financing, or rate buy-down credit?
- Is there a deadline driving the sale (1031 exchange, divorce, estate, relocation)? That informs how much negotiation room exists.
- The area grade is low — what's the realistic commute time and amenity access for the typical tenant pool here? Any planned neighborhood developments (good or bad) we should know about?
- What's the average days-on-market for RENTAL listings here right now (not sales)? A rising rental-DOM trend means longer vacancies and softer asking-rent achievability than the comps imply.
- What's the recent tenant-quality profile in this submarket — average credit score on applications, eviction rate, late-payment / NSF rate, and stable-employment percentage? A property-management company in the area should have these aggregated.
- How much new for-sale + rental construction is in the pipeline within 1–3 miles? Heavy new supply typically softens prices + rents 12–24 months out; constrained supply supports both.
Investment metrics
- 1% rule
- 0.81% ✗
- Cap rate
- 6.08%
- Cash-on-cash
- -0.77%
- DSCR
- 0.97
- GRM
- 10.3
CMA / ARV
No comps found within radius.
Projected returns pro-forma
-3.0% appreciation · 2.12% rent growth · sell at horizon
- IRR
- -18.5%
- Equity multiple
- 0.35×
- Total profit
- $-46,432
- Equity at exit
- $38,320
- IRR
- -12.7%
- Equity multiple
- 0.28×
- Total profit
- $-51,664
- Equity at exit
- $22,221
Cash invested: $71,960 (down + closing). Projections, not guarantees.
Landlord ↔ Tenant lean methodology
- Overall (STATE)
- 87 Strongly Landlord-Friendly
- State Florida
- 87 Strongly Landlord-Friendly · R+3
- County
- — inherits STATE
- City
- — inherits STATE
ZIP-level market 32953
- Home prices YoY
- -34.5%
- Rents YoY
- 2.1%
- Active inventory
- 221
- Price-to-rent
- 10.3×
Monthly cashflow live
- Estimated rent
- $2,078 high interval (Pro) →
- Mortgage (P&I)
- −$1,348
- Tax from tax record
- −$233 /mo · $2,794/yr
- Insurance
- −$107
- HOA
- −$0
- Vacancy / Maint / Mgmt
- −$436
- Net cashflow
- $-46
Break-even live
Sensitivity live
| Price | -10% $99 | -5% $27 | +0% $-46 | +5% $-119 | +10% $-192 |
|---|---|---|---|---|---|
| Rent | -10% $-210 | -5% $-128 | +0% $-46 | +5% $36 | +10% $118 |
| Rate | -1.0pp $83 | -0.5pp $19 | base $-46 | +0.5pp $-113 | +1.0pp $-181 |
UW: 25.0% down · 7.5% · 30yr · 1.5% tax · 5.0% vac · 8.0% maint · 8.0% mgmt
Financing live
Cash to close
- Down payment
- $64,250
- Closing costs
- $7,710
- Reserves months
- —
- Total cash needed
- —
Loan-product check · same deal, 3 products live
Conventional
25% down · 7.5% · 30yr
- Down + closing
- —
- Monthly P&I
- —
- Monthly cashflow
- —
- DSCR
- —
- Eligible?
- —
Personal DTI + credit; lowest rate.
DSCR
20% down · 8.5% · 30yr
- Down + closing
- —
- Monthly P&I
- —
- Monthly cashflow
- —
- DSCR
- —
- Eligible?
- —
No personal income docs; deal must DSCR.
Hard money
10% down · 12.0% · 12mo
- Down + closing
- —
- Monthly P&I
- —
- Monthly cashflow
- —
- DSCR
- —
- Eligible?
- —
Short-term bridge; refi at stabilization.
Rent comps 6 comps
| Address | Beds | Baths | Sqft | Rent | $/sqft | DOM | Units | Dist |
|---|---|---|---|---|---|---|---|---|
| 3077 Sea Gate Cir Merritt Island, FL | 2.0 | 2.0 | 1044 | $1,950 | $1.87 | 25d | 1 | 0.10mi |
| 104 Parrotfish Ln #101 Merritt Island, FL | 3.0 | 2.5 | 1487 | $2,750 | $1.85 | 25d | 1 | 0.22mi |
| 437 Via Palermo Ct Merritt Island, FL | 3.0 | 2.0 | 1375 | $2,175 | $1.58 | 25d | 1 | 0.39mi |
| 2610 Via Napoli Ct Merritt Island, FL | 3.0 | 2.0 | 1123 | $2,400 | $2.14 | 16d | 1 | 0.45mi |
| 100 Summer Pl #8 Merritt Island, FL | 2.0 | 2.0 | 1037 | $2,500 | $2.41 | 25d | 1 | 0.55mi |
| 650 Parkside Ave Merritt Island, FL | 2.0 | 2.0 | 1390 | $1,950 | $1.40 | 25d | 1 | 0.66mi |
Listing history 28 events
-
2026-06-22days on market $257,000 Active 53 DOM
-
2026-06-19price $257,000 Active 50 DOM
-
2026-06-18days on market $269,900 Active 50 DOM
-
2026-06-17days on market $269,900 Active 49 DOM
-
2026-06-16days on market $269,900 Active 48 DOM
-
2026-06-15days on market $269,900 Active 47 DOM
-
2026-06-14days on market $269,900 Active 45 DOM
-
2026-06-10days on market $269,900 Active 42 DOM
-
2026-06-08days on market $269,900 Active 40 DOM
-
2026-06-07days on market $269,900 Active 39 DOM
-
2026-06-05days on market $269,900 Active 36 DOM
-
2026-06-03days on market $269,900 Active 35 DOM
-
2026-06-02days on market $269,900 Active 34 DOM
-
2026-06-01days on market $269,900 Active 33 DOM
-
2026-05-31days on market $269,900 Active 32 DOM
-
2026-05-31days on market $269,900 Active 31 DOM
-
2026-04-29$272,999 Active
-
2026-01-01historical $1,800
-
2025-12-10price $1,800
-
2025-10-10price $1,850
-
2025-06-26$1,975
-
2012-02-17soldstatus $50,000
-
2012-02-02soldstatus $50,000 220-char remark
Show marketing remark (220 chars)
Nicely updated with a new kitchenw/ tiled countertops, tiled and laminate wood floors, updated bath vanities, painted in designer colors, roof replaced in 2003,A/C replaced in 2001, large lot fenced, beautiful oak trees.
-
2011-08-06$61,900 220-char remark
Show marketing remark (220 chars)
Nicely updated with a new kitchenw/ tiled countertops, tiled and laminate wood floors, updated bath vanities, painted in designer colors, roof replaced in 2003,A/C replaced in 2001, large lot fenced, beautiful oak trees.
-
2005-04-15soldstatus $159,900
-
2005-04-11soldstatus $145,000 139-char remark
Show marketing remark (139 chars)
``AS-IS``, 2/2/1, ROOF IS APPROX 2 YEARS OLD. A/C APPROX 4 YEARS OLD, SAME TENANT FOR 8 YEARS. UPGRADING NEEDED LIKE CARPET, PAINT, ETC. ..
-
2005-02-20$149,900 139-char remark
Show marketing remark (139 chars)
``AS-IS``, 2/2/1, ROOF IS APPROX 2 YEARS OLD. A/C APPROX 4 YEARS OLD, SAME TENANT FOR 8 YEARS. UPGRADING NEEDED LIKE CARPET, PAINT, ETC. ..
-
1994-04-30soldstatus $54,900
ⓘ Source: listings_history table (triggers on properties + properties_extension) + one-shot
backfill from property_details.listing_events for pre-trigger history.
Tax reassessment forecast FL · Resets to sale price
- Current annual tax
- $2,794 · $233/mo
- Projected year-2 tax
- $2,794 · $233/mo
- Expected delta
- $0/yr ($0/mo · 0.0%)
ⓘ Screening estimate from a state-policy table — verify with the county assessor before closing.
Climate risk First Street
- Flood 6/10 Major FEMA zone X (unshaded) · 54% chance over 30 yrs
- Wildfire 3/10 Moderate
- Heat 10/10 Extreme 7 d/yr ≥105°F today · 23 d/yr by 30 yrs out
- Wind 10/10 Extreme 99% chance of damaging wind over 30 yrs
- Air quality 1/10 Low 0 unhealthy d/yr today · 0 by 30 yrs out
Nearby sold comps map
Loading sold comps map…
Walkable amenities ~0.75 mi
Loading nearby amenities…
Taxation est. · year 1
- Rental income
- $24,934
- − Mortgage interest
- −$14,396
- − Property taxes
- −$2,794
- − Insurance
- −$1,285
- − Repairs & maintenance
- −$1,995
- − Management
- −$1,995
- − Depreciation
- −$7,476
- Taxable loss
- −$5,007
- Est. tax savings @ 24.0%
- +$1,202
- After-tax cash flow
- $648/yr
For passive investors: Depreciation is non-cash, so a rental often shows a tax loss while cash-flowing — sheltering income. Rental losses are passive: they offset passive income freely, and up to $25,000/yr can offset ordinary (W-2) income if you actively participate and your MAGI is under $100k (phasing out to $0 by $150k); unused losses carry forward. On sale, claimed depreciation is recaptured at up to 25%, and gains may owe capital-gains tax (a 1031 exchange can defer both). Figures are a year-1 estimate at your 24.0% rate — not tax advice; consult a CPA.
Schools (NCES district)
- District
- Brevard
- NCES district ID
- 1200150
- Math proficiency
- 53% ▼ -9.00%
- Reading proficiency
- 57% ▼ -4.00%
- Median HH income
- $49,426
- Composite
- 46.86/100
- National rank
- #2370
- State rank
- #19 of 73 in FL
Livability — North Merritt Island
No livability data for this city. (Only ~50 U.S. cities are tracked.)
Census & demographics
- Census place
- North Merritt Island, FL
- County
- Brevard County · 602,871 people
- City population
- 24,834
- Metro
- Palm Bay-Melbourne-Titusville, FL
- Population (ZIP)
- 24,759
- Household income
- $87,262
- Rent vs Own
- Severe rent burden
- 849.0
Population outlook (Brevard County) Hauer SSP2
- Today (2025)
- 623,254 people
- By 2030
- 648,420 · +4.0%
- By 2040
- 690,009 · +10.7%
- By 2050
- 715,669 · +14.8%
- By 2075
- 775,744 · +24.5%
- By 2100
- 776,687 · +24.6%
Race, ethnicity, and origin ACS 2023
- Neighborhood character
- Predominantly White (77%)
- Race & ethnicity
- White 77% Hispanic / Latino 13% Two or more races 7% Black 4% Asian 3%
- Hispanic origin (detail)
- Mexican 2% Puerto Rican 6%
- Common ancestry
- Slovak 3% Romanian 3% Lithuanian 3%
- Foreign-born
- 9% · Canada, China, Jamaica
- Languages at home
- 87% English-only · Spanish 8% Tagalog/Filipino 2% French/Haitian/Cajun 1%
Political lean MEDSL · Brevard
- 2024 margin
- Strong R (+20.8) · D 39.1% · R 59.9% · Other 1.0%
- 2008→2024 swing
- -10.4pp toward R · 2008: -10.4pp · 2024: -20.8pp
- All cycles
- 2024: R+20.8 2020: R+16.4 2016: R+19.8 2012: R+12.7 2008: R+10.4
Not yet ingested
- Civics
- —
Market trends
- HPI YoY
- ▼ -168.76%
- Current HPI
- 320.1966
- Rent YoY
- ▲ 2.12%
- Metro
- Palm Bay-Melbourne-Titusville, FL
- State GDP YoY
- ▲ 3.28%
- F500 in state
- 36
Industry mix (Fortune 500 HQ in FL)
| Industry | F500 HQs | Revenue |
|---|---|---|
| Industrial Technology | 2 | $29B |
|
||
| Insurance | 2 | $17B |
|
||
| Retail | 1 | $60B |
|
||
| Technology Distribution | 1 | $58B |
|
||
| Homebuilding | 1 | $35B |
|
||
| Technology Manufacturing | 1 | $35B |
|
||
Price history
+397.3% since first listed12 events — show timeline
- 2026-04-29 Listed $272,999 SCMLS
- 2026-01-01 Rental Removed $1,800 SCMLS
- 2025-12-10 Price Changed $1,800 SCMLS
- 2025-10-10 Price Changed $1,850 SCMLS
- 2025-06-26 Listed for Rent $1,975 SCMLS
- 2012-02-17 Sold (Public Records) $50,000 Public Records
- 2012-02-02 Sold (MLS) $50,000 SCMLS
- 2011-08-06 Listed $61,900 SCMLS
- 2005-04-15 Sold (Public Records) $159,900 Public Records
- 2005-04-11 Sold (MLS) $145,000 SCMLS
- 2005-02-20 Listed $149,900 SCMLS
- 1994-04-30 Sold (Public Records) $54,900 Public Records
Property tax history
+6.8%/yrLatest (2025): $2,794 · +6.5% YoY. Source: county tax records.
Cash-flow waterfall
monthlySold comps — $/sqft
last 12 mo · ≤1 miLoading sold comps…