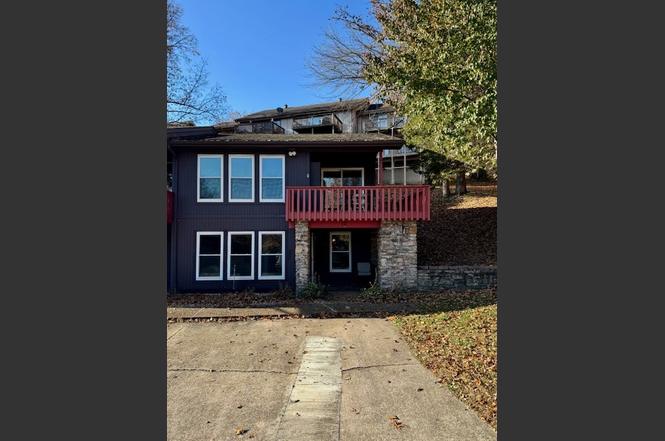
15 Nantucket Dr
Bella Vista, AR 72715
$228,400C
3 bd · 2.0 ba ·
1,504 sqft ·
Built 1976
· SingleFamily
· Active
· 216 DOM
Cashflow @ list (25.0% down · 7.5%)
Estimated rent
$2,197/mo
Mortgage (P&I)
−$1,198
Tax + insurance
−$293
HOA
−$24
Vac / Maint / Mgmt
−$461
Net cashflow
$220/mo
Annual
$2,646/yr
Cap rate
7.45%
Cash-on-cash
4.14%
DSCR
1.18
1% rule
0.96%
Cash to close
$63,952
Investor read
- This is a 3-bed/2.0-bath single-family listed at $228k.
- At list price, monthly cash flow is $220 ($3k/yr) — positive.
- The deal already cash-flows at list — no discount required.
- To meet the 1% rule (rent ≥ 1% of price), the offer needs to be $220k (3.8% below list).
- It's been on market 216 days — a 12% lower offer ($201k) is reasonable based on typical stale-listing flexibility.
- Recommended offer: $201k (12.0% below list) — sets the bar for market timing.
- Local home prices are declining (-3.0%/yr); year-one equity from $2k of loan paydown is wiped out by about $7k of value loss. Plan a longer hold.
- Location reads 67/100 on livability (#111 in AR) — a middle-class / working-renter tenant base. Strengths: cost of living A+, housing A+, schools A; Watch: amenities F, commute F, health & safety F.
- Bentonville School District (urban): math 59% / reading 59% proficiency, ranked #3 of 238 in AR (top 1%) — acceptable for families but not a draw, mixed tenant base, ~2y average lease.
- Market conditions: 827 active listings in the ZIP; 7 comparable units currently listed for rent nearby; rentals at typical pace (median 14d on market — plan ~3-4 weeks tenant-placement turnaround); solid renter incomes; 4,359 units permitted in Benton County in 2024 (402 in 5+ unit buildings).
- Benton County population projected at +56% by 2050 — long-run rental-demand tailwind backs the buy-and-hold thesis.
- 6 sale attempts since 10y ago; this cycle's ask is 15127% above the opening price — seller raised mid-cycle; expect resistance to lowballs.
- Climate carrying-cost: extreme-heat days projected 7→21/yr by 2055 (HVAC capex compounding) — expect insurance premiums to compound above CPI over the hold.
- Cap rate 7.5% vs local median 3.6% in Bella Vista — top-decile yield for the area; either an underpriced asset or a hidden risk that comps aren't pricing in. Stress-test before assuming the spread holds.
- This rent runs 32% of the median local income ($82k/yr) — at the standard rent-burdened threshold; future hikes will face affordability resistance.
Questions for listing agent
- It's been on market 216 days. Have you received any prior offers? Is the seller open to a 12% concession, seller financing, or rate buy-down credit?
- Built in 1976 — when were the roof, HVAC, electrical panel, plumbing, and water heater last replaced?
- What does the HOA fee cover, when was the last increase, and are there any pending special assessments or reserve-fund shortfalls?
- Why hasn't it sold? Are there any deal-killer items the seller is aware of (foundation, flood, title, zoning, code violations)?
- Is there a deadline driving the sale (1031 exchange, divorce, estate, relocation)? That informs how much negotiation room exists.
- Schools are A-rated — typically a magnet for longer-tenancy family renters. What's the average tenant stay here, and is there a school-zone premium baked into asking?
- What's the average days-on-market for RENTAL listings here right now (not sales)? A rising rental-DOM trend means longer vacancies and softer asking-rent achievability than the comps imply.
- What's the recent tenant-quality profile in this submarket — average credit score on applications, eviction rate, late-payment / NSF rate, and stable-employment percentage? A property-management company in the area should have these aggregated.
CashFlowRE · CFR-MD77CQ37PF3MAJ
· Data 2 days ago
cashflowre.app · 2026-05-29