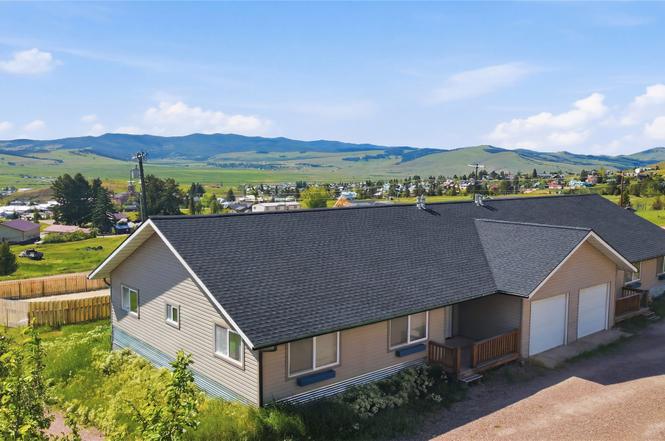
626 Ohio St #1
Philipsburg, MT 59858
$389,000B+
4 bd · 2.0 ba ·
2,774 sqft ·
Built 2005
· MultiFamily
· Active
· 2 DOM
Cashflow @ list (25.0% down · 7.5%)
Estimated rent
$4,997/mo
Mortgage (P&I)
−$2,040
Tax + insurance
−$329
HOA
−$0
Vac / Maint / Mgmt
−$1,049
Net cashflow
$1,579/mo
Annual
$18,949/yr
Cap rate
11.16%
Cash-on-cash
17.40%
DSCR
1.77
1% rule
1.28%
Cash to close
$108,920
Investor read
- This is a 4 × 3-bed/2.0-bath units multifamily listed at $389k.
- At list price, monthly cash flow is $2k ($19k/yr) — positive. Per door: $395/mo.
- The deal already cash-flows at list — no discount required.
- Meets the 1% rule at list price ($5k rent vs $389k).
- Only 2 days on market — expect competitive offers; lowballing is unlikely to land.
- In year one you build about $42k of equity ($3k loan paydown + $39k appreciation (10.0% local appreciation)).
- Location reads 66/100 on livability (#119 in MT) — a middle-class / working-renter tenant base. Strengths: cost of living A+, health & safety A+; Watch: crime F, amenities F, commute F.
- Philipsburg K-12 Schools (rural): math 40% / reading 65% proficiency, ranked #59 of 339 in MT (top 17%) — acceptable for families but not a draw, mixed tenant base, ~2y average lease.
- Zoned schools: Philipsburg School (math 34% / reading 44%, grade F, #166 of 293 statewide, top 61%, 94 students, 0% FRL); Philipsburg 7-8 (math 30% / reading 50%, 25 students, 0% FRL); Granite High School (math 10% / reading 50%, grade F, #66 of 132 statewide, top 52%, 62 students, 0% FRL) — zoned schools average 0% FRL vs 31% district-wide (31 pts lower); this property's tenant base skews higher-income than the district average.
- Zoned-school proficiency averages 36% at this address vs 52% district-wide (-16 pts) — the specific schools serving this property underperform the Philipsburg K-12 Schools average; the district grade overstates school quality for this exact location.
- Market conditions: 71 active listings in the ZIP.
- Granite County population projected at +13% by 2050 — modest demand growth; plan on rents tracking national, not racing it.
- At projected returns (10.0% appreciation + 3.0% rent growth), your $109k cash investment doubles in ~2 years — after that, you're playing with house money.
- By year 2, paydown + projected appreciation supports a ~$67k cash-out refi (75% LTV) — recoverable capital for the next deal without selling this one.
- Climate carrying-cost: major wildfire risk — expect insurance premiums to compound above CPI over the hold.
- Cap rate 11.2% vs local median 1.2% in Philipsburg — top-decile yield for the area; either an underpriced asset or a hidden risk that comps aren't pricing in. Stress-test before assuming the spread holds.
Questions for listing agent
- Can we see the unit-by-unit rent roll, current vacancy, and any below-market leases? What's the average tenancy length?
- What capital expenditures (roof, boiler, parking lot, exteriors) have been made in the last 5 years, and what's planned in the next 2?
- Is there a deadline driving the sale (1031 exchange, divorce, estate, relocation)? That informs how much negotiation room exists.
- Crime grade is F in this area — have there been break-ins, vandalism, or insurance claims at this property in the last 3 years? What carrier currently insures it and at what premium?
- What's the average days-on-market for RENTAL listings here right now (not sales)? A rising rental-DOM trend means longer vacancies and softer asking-rent achievability than the comps imply.
- What's the recent tenant-quality profile in this submarket — average credit score on applications, eviction rate, late-payment / NSF rate, and stable-employment percentage? A property-management company in the area should have these aggregated.
- How much new apartment / multifamily construction is in the pipeline within 1–3 miles? Heavy new supply (>2% of stock underway) typically softens rents 12–24 months out; light construction supports rent growth.
CashFlowRE · CFR-MEQRAVDJXHR056
· Data 3 days ago
cashflowre.app · 2026-05-29