 Fourplex
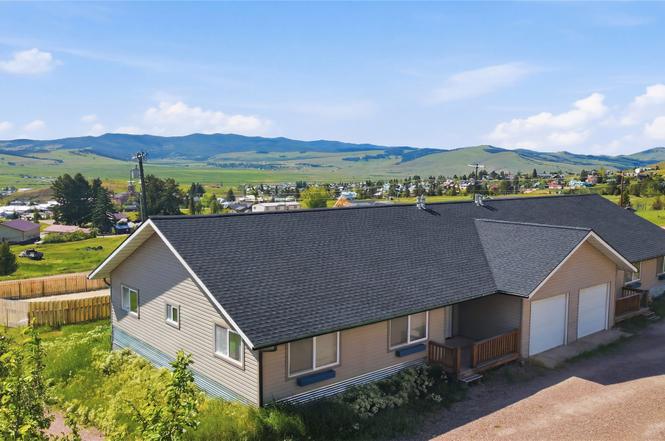
626 Ohio St #1 · Philipsburg, MT
Flood risk 1/10 · Minimal
- FEMA flood zone
- X (unshaded)
- Chance of flooding over 30 yrs
- 0.0%
- Est. flood insurance / yr
- $507 – $1,088
Fire risk 7/10 · Major
- Est. fire insurance / yr
- $918 – $1,706
Heat risk 1/10 · Minimal
- Hot days now (above 83°F)
- 10 days/yr
- Hot days in 30 yrs
- 24 days/yr
Wind risk 1/10 · Minimal
- Chance of severe wind over 30 yrs
- —
Air-quality risk 10/10 · Severe
- Unhealthy air days now
- 28 days/yr
- Unhealthy air days in 30 yrs
- 37 days/yr
Risk factors via First Street. Map © Google.
Why this score? — see what drove the B+ grade
The composite is a weighted blend of 9 inputs, each scored 0–100. Each bar is that input's sub-score; the figure is the points it added to the 100-point composite (weight × sub-score).
- Cash flow +30.0/30.0
- DSCR +10.0/10.0
- Appreciation +10.0/10.0
- 1% rule +7.8/10.0
- ARV discount +7.5/15.0
- Schools +4.6/10.0
- Livability +3.3/5.0
- Rent growth +2.5/5.0
- Condition / age +2.5/5.0
$389,000
🖨 Deal sheet (PDF) 📄 Offer letter ✓ Due diligence
Multi-family units
County records classify this as Multi-Family (2-4 Unit). Listing-text estimate: 4 units. confirmed
Key facts
- Private deck
- Private bath
- Spacious kitchen
Tags
Property features AI
Finance
- Financial info: Annual tax amount listed
Exterior
- Parking: Detached or attached garage with 1 garage space
- Home design: Residential income property; Duplex
- Construction: Slab foundation
- Exterior features: Lot approximately 0.292 acres (12,720 sq ft)
Interior
- Bedrooms: Three bedrooms (in at least one unit)
- Bathrooms: Two bathrooms (total)
- Interior features: Two-unit duplex
Neighborhood map
What this means for you Summary
Snapshot
- This is a 4 × 3-bed/2.0-bath units multifamily listed at $389k.
Deal economics
- At list price, monthly cash flow is $2k ($19k/yr) — positive. Per door: $395/mo.
- The deal already cash-flows at list — no discount required.
- Meets the 1% rule at list price ($5k rent vs $389k).
- Cap rate 11.2% vs local median 1.2% in Philipsburg — top-decile yield for the area; either an underpriced asset or a hidden risk that comps aren't pricing in. Stress-test before assuming the spread holds.
Location & tenants
- Location reads 66/100 on livability (#119 in MT) — a middle-class / working-renter tenant base. Strengths: cost of living A+, health & safety A+; Watch: crime F, amenities F, commute F.
- Philipsburg K-12 Schools (rural): math 40% / reading 65% proficiency, ranked #59 of 339 in MT (top 17%) — acceptable for families but not a draw, mixed tenant base, ~2y average lease.
- Zoned schools: Philipsburg School (math 34% / reading 44%, grade F, #166 of 293 statewide, top 61%, 94 students, 0% FRL); Philipsburg 7-8 (math 30% / reading 50%, 25 students, 0% FRL); Granite High School (math 10% / reading 50%, grade F, #66 of 132 statewide, top 52%, 62 students, 0% FRL) — zoned schools average 0% FRL vs 31% district-wide (31 pts lower); this property's tenant base skews higher-income than the district average.
- Zoned-school proficiency averages 36% at this address vs 52% district-wide (-16 pts) — the specific schools serving this property underperform the Philipsburg K-12 Schools average; the district grade overstates school quality for this exact location.
- Market conditions: 71 active listings in the ZIP.
Forward outlook
- In year one you build about $42k of equity ($3k loan paydown + $39k appreciation (10.0% local appreciation)).
- Granite County population projected at +13% by 2050 — modest demand growth; plan on rents tracking national, not racing it.
- At projected returns (10.0% appreciation + 3.0% rent growth), your $109k cash investment doubles in ~2 years — after that, you're playing with house money.
- By year 2, paydown + projected appreciation supports a ~$67k cash-out refi (75% LTV) — recoverable capital for the next deal without selling this one.
Negotiation context
- Only 2 days on market — expect competitive offers; lowballing is unlikely to land.
Risks & watch-outs
- Climate carrying-cost: major wildfire risk — expect insurance premiums to compound above CPI over the hold.
Questions for the listing agent
- Can we see the unit-by-unit rent roll, current vacancy, and any below-market leases? What's the average tenancy length?
- What capital expenditures (roof, boiler, parking lot, exteriors) have been made in the last 5 years, and what's planned in the next 2?
- Is there a deadline driving the sale (1031 exchange, divorce, estate, relocation)? That informs how much negotiation room exists.
- Crime grade is F in this area — have there been break-ins, vandalism, or insurance claims at this property in the last 3 years? What carrier currently insures it and at what premium?
- What's the average days-on-market for RENTAL listings here right now (not sales)? A rising rental-DOM trend means longer vacancies and softer asking-rent achievability than the comps imply.
- What's the recent tenant-quality profile in this submarket — average credit score on applications, eviction rate, late-payment / NSF rate, and stable-employment percentage? A property-management company in the area should have these aggregated.
- How much new apartment / multifamily construction is in the pipeline within 1–3 miles? Heavy new supply (>2% of stock underway) typically softens rents 12–24 months out; light construction supports rent growth.
Investment metrics
- 1% rule
- 1.28% ✓
- Cap rate
- 11.16%
- Cash-on-cash
- 17.40%
- DSCR
- 1.77
- GRM
- 6.5
CMA / ARV
No comps found within radius.
Projected returns pro-forma
10.0% appreciation · 3.0% rent growth · sell at horizon
- IRR
- 37.2%
- Equity multiple
- 3.87×
- Total profit
- $312,310
- Equity at exit
- $350,442
- IRR
- 32.0%
- Equity multiple
- 8.72×
- Total profit
- $840,371
- Equity at exit
- $755,741
Cash invested: $108,920 (down + closing). Projections, not guarantees.
Landlord ↔ Tenant lean methodology
- Overall (STATE)
- 82 Strongly Landlord-Friendly
- State Montana
- 82 Strongly Landlord-Friendly · R+11
- County
- — inherits STATE
- City
- — inherits STATE
ZIP-level market 59858
- Home prices YoY
- 13.1%
- Active inventory
- 71
- Price-to-rent
- 25.9×
Monthly cashflow live
- Estimated rent
- $4,997 medium interval (Pro) →
- Mortgage (P&I)
- −$2,040
- Tax from tax record
- −$167 /mo · $1,998/yr
- Insurance
- −$162
- HOA
- −$0
- Vacancy / Maint / Mgmt
- −$1,049
- Net cashflow
- $1,579
Break-even live
Sensitivity live
| Price | -10% $1,799 | -5% $1,689 | +0% $1,579 | +5% $1,469 | +10% $1,359 |
|---|---|---|---|---|---|
| Rent | -10% $1,184 | -5% $1,382 | +0% $1,579 | +5% $1,776 | +10% $1,974 |
| Rate | -1.0pp $1,775 | -0.5pp $1,678 | base $1,579 | +0.5pp $1,478 | +1.0pp $1,376 |
4-unit breakdown (identical units grouped — click to expand)
| Units | Beds | Baths | Est. rent |
|---|---|---|---|
| 4× units | 3 | 2 | $4,996 |
| #1 | 3 | 2 | $1,249 |
| #2 | 3 | 2 | $1,249 |
| #3 | 3 | 2 | $1,249 |
| #4 | 3 | 2 | $1,249 |
| Total (4 units) | $4,997 | ||
UW: 25.0% down · 7.5% · 30yr · 1.5% tax · 5.0% vac · 8.0% maint · 8.0% mgmt
Financing live
Cash to close
- Down payment
- $97,250
- Closing costs
- $11,670
- Reserves months
- —
- Total cash needed
- —
Loan-product check · same deal, 3 products live
Conventional
25% down · 7.5% · 30yr
- Down + closing
- —
- Monthly P&I
- —
- Monthly cashflow
- —
- DSCR
- —
- Eligible?
- —
Personal DTI + credit; lowest rate.
DSCR
20% down · 8.5% · 30yr
- Down + closing
- —
- Monthly P&I
- —
- Monthly cashflow
- —
- DSCR
- —
- Eligible?
- —
No personal income docs; deal must DSCR.
Hard money
10% down · 12.0% · 12mo
- Down + closing
- —
- Monthly P&I
- —
- Monthly cashflow
- —
- DSCR
- —
- Eligible?
- —
Short-term bridge; refi at stabilization.
Listing history 2 events
-
2026-06-18days on market $389,000 Active 2 DOM
-
2026-06-16$389,000 Active 1 DOM
ⓘ Source: listings_history table (triggers on properties + properties_extension) + one-shot
backfill from property_details.listing_events for pre-trigger history.
Tax reassessment forecast MT · Resets to sale price
- Current annual tax
- $1,998 · $167/mo
- Projected year-2 tax
- $3,268 · $272/mo
- Expected delta
- +$1,269/yr (+$106/mo · 63.5%)
ⓘ Screening estimate from a state-policy table — verify with the county assessor before closing.
Climate risk First Street
- Flood 1/10 Low FEMA zone X (unshaded) · 0% chance over 30 yrs
- Wildfire 7/10 Severe
- Heat 1/10 Low 10 d/yr ≥83°F today · 24 d/yr by 30 yrs out
- Wind 1/10 Low
- Air quality 10/10 Extreme 28 unhealthy d/yr today · 37 by 30 yrs out
Nearby sold comps map
Loading sold comps map…
Walkable amenities ~0.75 mi
Loading nearby amenities…
Taxation est. · year 1
- Rental income
- $59,964
- − Mortgage interest
- −$21,790
- − Property taxes
- −$1,998
- − Insurance
- −$1,945
- − Repairs & maintenance
- −$4,797
- − Management
- −$4,797
- − Depreciation
- −$11,316
- Taxable income
- $13,320
- Est. tax owed @ 24.0%
- −$3,197
- After-tax cash flow
- $15,752/yr
For passive investors: Depreciation is non-cash, so a rental often shows a tax loss while cash-flowing — sheltering income. Rental losses are passive: they offset passive income freely, and up to $25,000/yr can offset ordinary (W-2) income if you actively participate and your MAGI is under $100k (phasing out to $0 by $150k); unused losses carry forward. On sale, claimed depreciation is recaptured at up to 25%, and gains may owe capital-gains tax (a 1031 exchange can defer both). Figures are a year-1 estimate at your 24.0% rate — not tax advice; consult a CPA.
Schools (NCES district)
- District
- Philipsburg K-12 Schools
- NCES district ID
- 3012840
- Math proficiency
- 40% ▼ -5.00%
- Reading proficiency
- 65% ▲ 15.00%
- Median HH income
- $46,664
- Composite
- 46.41/100
- National rank
- #5351
- State rank
- #59 of 339 in MT
Livability — Philipsburg
- Score
- 66/100
- State rank
- #119
- US rank
- #11829
Category grades
Schools grade is shown separately in the Schools card above.
Census & demographics
- Census place
- Philipsburg, MT
- Population (ZIP)
- 1,737
Population outlook (Granite County) Hauer SSP2
- Today (2025)
- 3,521 people
- By 2030
- 3,631 · +3.1%
- By 2040
- 3,788 · +7.6%
- By 2050
- 3,972 · +12.8%
- By 2075
- 4,823 · +37.0%
- By 2100
- 5,660 · +60.7%
Race, ethnicity, and origin ACS 2023
- Neighborhood character
- Predominantly White (87%)
- Race & ethnicity
- White 87% Two or more races 5% Native American 4% Hispanic / Latino 4% Black 1% Asian 1%
- Common ancestry
- Slovak 6% Portuguese 5% Lithuanian 3%
- Foreign-born
- 3% · Canada
- Languages at home
- 97% English-only · Spanish 2% Chinese 1%
Political lean MEDSL · Granite
- 2024 margin
- Solid R (+44.0) · D 26.6% · R 70.6% · Other 2.8%
- 2008→2024 swing
- -20.0pp toward R · 2008: -24.0pp · 2024: -44.0pp
- All cycles
- 2024: R+44.0 2020: R+37.2 2016: R+40.6 2012: R+33.7 2008: R+24.0
Not yet ingested
- Civics
- —
Market trends
- HPI YoY
- ▲ 33.61%
- Current HPI
- 290.8626
- Rent YoY
- —
- Metro
- —
- State GDP YoY
- ▲ 3.41%
- F500 in state
- 2
Industry mix (Fortune 500 HQ in MT)
| Industry | F500 HQs | Revenue |
|---|---|---|
| Technology / Analytics | 1 | $2B |
|
||
Price history
2 events — show timeline
- 2026-06-16 Listed $389,000 MRMLS
- 2003-11-19 Sold (Public Records) — Public Records
Property tax history
+1.9%/yrLatest (2025): $1,998 · +3.5% YoY. Source: county tax records.
Cash-flow waterfall
monthlySold comps — $/sqft
last 12 mo · ≤1 miLoading sold comps…