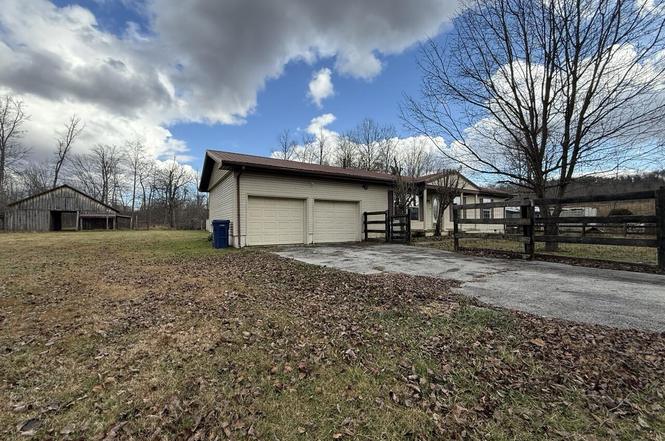
1331 Old Barbourville Rd
Corbin, KY 40701
$124,900D
3 bd · 2.0 ba ·
1,104 sqft ·
Built 1978
· SingleFamily
· Pending
· 50 DOM
Cashflow @ list (25.0% down · 7.5%)
Estimated rent
$1,097/mo
Mortgage (P&I)
−$655
Tax + insurance
−$296
HOA
−$0
Vac / Maint / Mgmt
−$230
Net cashflow
$-84/mo
Annual
$-1,007/yr
Cap rate
6.13%
Cash-on-cash
-0.60%
DSCR
0.97
1% rule
0.88%
Cash to close
$34,972
Investor read
- This is a 3-bed/2.0-bath single-family listed at $125k.
- At list price, monthly cash flow is $-84 ($-1k/yr) — negative.
- To cash-flow at today's rent, offer at most $110k (11.9% below list).
- To meet the 1% rule (rent ≥ 1% of price), the offer needs to be $110k (12.1% below list).
- It's been on market 50 days — a 3% lower offer ($121k) is reasonable based on typical stale-listing flexibility.
- Recommended offer: $110k (12.1% below list) — sets the bar for 1% rule.
- In year one you build about $3k of equity ($864 loan paydown + $2k appreciation (1.8% local appreciation)).
- Location reads 69/100 on livability (#179 in KY) — a middle-class / working-renter tenant base. Strengths: cost of living A+, housing A+, crime A-; Watch: amenities F, commute F, employment F.
- Knox County (town): math 24% / reading 38% proficiency, ranked #116 of 165 in KY (top 70%) — families likely to look elsewhere, expect single-tenant / working-renter base with shorter leases; 68% free/reduced lunch — lower-income household profile, screen leases tightly.
- Zoned schools: Lynn Camp Elementary School (525 students, 89% FRL); Knox County Middle School (math 17% / reading 42%, grade F, #151 of 217 statewide, top 71%, 429 students, 81% FRL); Lynn Camp Middle High School (465 students, 85% FRL) — zoned schools average 85% FRL vs 68% district-wide (17 pts higher); higher-poverty schools than district average — tighter screening recommended.
- Watch-outs: flood insurance adds $66/mo.
- Market conditions: 331 active listings in the ZIP.
- Knox County population projected at -16% by 2050 — secular population decline; favor cash flow + early exit over multi-decade hold.
- 6 sale attempts since 5y ago with the ask held roughly flat each time — persistent listings suggest the price (not the market) is what's stuck; bring a comps-based counter.
- By year 10, paydown + projected appreciation supports a ~$31k cash-out refi (75% LTV) — recoverable capital for the next deal without selling this one.
- Climate carrying-cost: major flood risk; major wildfire risk — expect insurance premiums to compound above CPI over the hold.
- Cap rate 6.1% vs local median 3.3% in Corbin — top-decile yield for the area; either an underpriced asset or a hidden risk that comps aren't pricing in. Stress-test before assuming the spread holds.
Questions for listing agent
- What do current leases actually rent for vs. the listed asking? Can we see a recent rent roll and the last 12 months of T-12 income?
- It's been on market 50 days. Have you received any prior offers? Is the seller open to a 12% concession, seller financing, or rate buy-down credit?
- Built in 1978 — when were the roof, HVAC, electrical panel, plumbing, and water heater last replaced?
- What's the actual annual flood-insurance premium (NFIP or private), and is the property in a SFHA with mandatory coverage?
- Is there a deadline driving the sale (1031 exchange, divorce, estate, relocation)? That informs how much negotiation room exists.
- Schools are B-rated — typically a magnet for longer-tenancy family renters. What's the average tenant stay here, and is there a school-zone premium baked into asking?
- The area grade is low — what's the realistic commute time and amenity access for the typical tenant pool here? Any planned neighborhood developments (good or bad) we should know about?
- What's the average days-on-market for RENTAL listings here right now (not sales)? A rising rental-DOM trend means longer vacancies and softer asking-rent achievability than the comps imply.
CashFlowRE · CFR-MEQRM60NY00A5Y
· Data 4 weeks ago
cashflowre.app · 2026-05-29