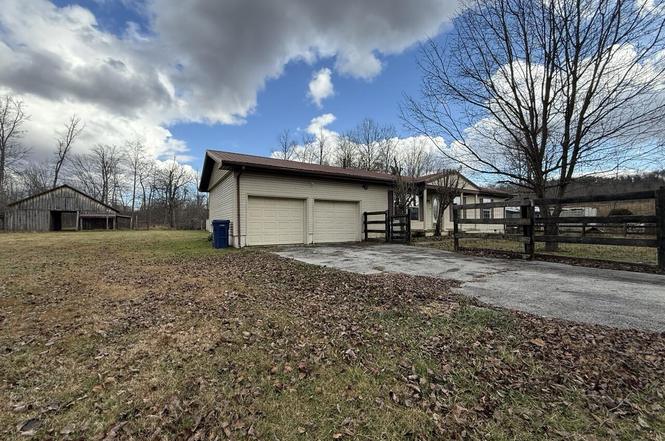
1331 Old Barbourville Rd · Corbin, KY
Flood risk 7/10 · Major
- FEMA flood zone
- X (unshaded)
- Chance of flooding over 30 yrs
- 0.99%
- Est. flood insurance / yr
- $507 – $1,088
Fire risk 7/10 · Major
- Est. fire insurance / yr
- $839 – $1,559
Heat risk 4/10 · Minor
- Hot days now (above 99°F)
- 7 days/yr
- Hot days in 30 yrs
- 19 days/yr
Wind risk 2/10 · Minimal
- Chance of severe wind over 30 yrs
- 4.0%
Air-quality risk 2/10 · Minimal
- Unhealthy air days now
- 0 days/yr
- Unhealthy air days in 30 yrs
- 1 days/yr
Risk factors via First Street. Map © Google.
Why this score? — see what drove the D grade
The composite is a weighted blend of 9 inputs, each scored 0–100. Each bar is that input's sub-score; the figure is the points it added to the 100-point composite (weight × sub-score).
- Cash flow +12.5/30.0
- ARV discount +7.5/15.0
- Appreciation +5.9/10.0
- 1% rule +3.8/10.0
- DSCR +3.7/10.0
- Livability +3.5/5.0
- Rent growth +2.5/5.0
- Schools +2.5/10.0
- Condition / age +2.5/5.0
$124,900
🖨 Deal sheet (PDF) 📄 Offer letter ✓ Due diligence
Listing remarks
Located just off New Corbin Bypass, this home offers 3 bedrooms and 1 full bathroom plus 1 half bathroom. Features include a sunroom and a rear yard that backs up to trees. The property also includes a large barn and a privacy-fenced area directly behind the house. Purchasers may use any lender they chose to finance the purchase of a property. However, the seller requires that all non-cash offers must be pre-qualified by NewRez Home Loan Division prior to offer acceptance. For the free pre-qualification, contact Heidi Griffith at heidi. [email protected].
Key facts
- Backs up to trees
- Rear yard
- Sunroom
Tags
Neighborhood map
What this means for you Summary
Snapshot
- This is a 3-bed/2.0-bath single-family listed at $125k.
Deal economics
- At list price, monthly cash flow is $-84 ($-1k/yr) — negative.
- To cash-flow at today's rent, offer at most $110k (11.9% below list).
- To meet the 1% rule (rent ≥ 1% of price), the offer needs to be $110k (12.1% below list).
- Recommended offer: $110k (12.1% below list) — sets the bar for 1% rule.
- Cap rate 6.1% vs local median 3.3% in Corbin — top-decile yield for the area; either an underpriced asset or a hidden risk that comps aren't pricing in. Stress-test before assuming the spread holds.
Location & tenants
- Location reads 69/100 on livability (#179 in KY) — a middle-class / working-renter tenant base. Strengths: cost of living A+, housing A+, crime A-; Watch: amenities F, commute F, employment F.
- Knox County (town): math 24% / reading 38% proficiency, ranked #116 of 165 in KY (top 70%) — families likely to look elsewhere, expect single-tenant / working-renter base with shorter leases; 68% free/reduced lunch — lower-income household profile, screen leases tightly.
- Zoned schools: Lynn Camp Elementary School (525 students, 89% FRL); Knox County Middle School (math 17% / reading 42%, grade F, #151 of 217 statewide, top 71%, 429 students, 81% FRL); Lynn Camp Middle High School (465 students, 85% FRL) — zoned schools average 85% FRL vs 68% district-wide (17 pts higher); higher-poverty schools than district average — tighter screening recommended.
- Market conditions: 331 active listings in the ZIP.
Forward outlook
- In year one you build about $3k of equity ($864 loan paydown + $2k appreciation (1.8% local appreciation)).
- Knox County population projected at -16% by 2050 — secular population decline; favor cash flow + early exit over multi-decade hold.
- By year 10, paydown + projected appreciation supports a ~$31k cash-out refi (75% LTV) — recoverable capital for the next deal without selling this one.
Negotiation context
- It's been on market 50 days — a 3% lower offer ($121k) is reasonable based on typical stale-listing flexibility.
- 6 sale attempts since 5y ago with the ask held roughly flat each time — persistent listings suggest the price (not the market) is what's stuck; bring a comps-based counter.
Risks & watch-outs
- Watch-outs: flood insurance adds $66/mo.
- Climate carrying-cost: major flood risk; major wildfire risk — expect insurance premiums to compound above CPI over the hold.
Questions for the listing agent
- What do current leases actually rent for vs. the listed asking? Can we see a recent rent roll and the last 12 months of T-12 income?
- It's been on market 50 days. Have you received any prior offers? Is the seller open to a 12% concession, seller financing, or rate buy-down credit?
- Built in 1978 — when were the roof, HVAC, electrical panel, plumbing, and water heater last replaced?
- What's the actual annual flood-insurance premium (NFIP or private), and is the property in a SFHA with mandatory coverage?
- Is there a deadline driving the sale (1031 exchange, divorce, estate, relocation)? That informs how much negotiation room exists.
- Schools are B-rated — typically a magnet for longer-tenancy family renters. What's the average tenant stay here, and is there a school-zone premium baked into asking?
- The area grade is low — what's the realistic commute time and amenity access for the typical tenant pool here? Any planned neighborhood developments (good or bad) we should know about?
- What's the average days-on-market for RENTAL listings here right now (not sales)? A rising rental-DOM trend means longer vacancies and softer asking-rent achievability than the comps imply.
- What's the recent tenant-quality profile in this submarket — average credit score on applications, eviction rate, late-payment / NSF rate, and stable-employment percentage? A property-management company in the area should have these aggregated.
- How much new for-sale + rental construction is in the pipeline within 1–3 miles? Heavy new supply typically softens prices + rents 12–24 months out; constrained supply supports both.
Investment metrics
- 1% rule
- 0.88% ✗
- Cap rate
- 6.13%
- Cash-on-cash
- -0.60%
- DSCR
- 0.97
- GRM
- 9.5
CMA / ARV
No comps found within radius.
Projected returns pro-forma
1.82% appreciation · 3.0% rent growth · sell at horizon
- IRR
- 1.2%
- Equity multiple
- 1.06×
- Total profit
- $2,180
- Equity at exit
- $48,082
- IRR
- 5.4%
- Equity multiple
- 1.72×
- Total profit
- $25,282
- Equity at exit
- $68,342
Cash invested: $34,972 (down + closing). Projections, not guarantees.
Landlord ↔ Tenant lean methodology
- Overall (STATE)
- 83 Strongly Landlord-Friendly
- State Kentucky
- 83 Strongly Landlord-Friendly · R+16
- County
- — inherits STATE
- City
- — inherits STATE
ZIP-level market 40701
- Home prices YoY
- 0.6%
- Active inventory
- 331
- Price-to-rent
- 9.5×
Monthly cashflow live
- Estimated rent
- $1,097 medium interval (Pro) →
- Mortgage (P&I)
- −$655
- Tax from tax record
- −$177 /mo · $2,129/yr
- Insurance
- −$52
- Flood insurance flood zone
- −$66 /mo · $798/yr
- HOA
- −$0
- Vacancy / Maint / Mgmt
- −$230
- Net cashflow
- $-84
Break-even live
Sensitivity live
| Price | -10% $-13 | -5% $-49 | +0% $-84 | +5% $-119 | +10% $-155 |
|---|---|---|---|---|---|
| Rent | -10% $-171 | -5% $-127 | +0% $-84 | +5% $-41 | +10% $3 |
| Rate | -1.0pp $-21 | -0.5pp $-52 | base $-84 | +0.5pp $-116 | +1.0pp $-149 |
UW: 25.0% down · 7.5% · 30yr · 1.5% tax · 5.0% vac · 8.0% maint · 8.0% mgmt
Financing live
Cash to close
- Down payment
- $31,225
- Closing costs
- $3,747
- Reserves months
- —
- Total cash needed
- —
Loan-product check · same deal, 3 products live
Conventional
25% down · 7.5% · 30yr
- Down + closing
- —
- Monthly P&I
- —
- Monthly cashflow
- —
- DSCR
- —
- Eligible?
- —
Personal DTI + credit; lowest rate.
DSCR
20% down · 8.5% · 30yr
- Down + closing
- —
- Monthly P&I
- —
- Monthly cashflow
- —
- DSCR
- —
- Eligible?
- —
No personal income docs; deal must DSCR.
Hard money
10% down · 12.0% · 12mo
- Down + closing
- —
- Monthly P&I
- —
- Monthly cashflow
- —
- DSCR
- —
- Eligible?
- —
Short-term bridge; refi at stabilization.
Listing history 25 events
-
2026-03-28status Pending
-
2026-02-06$124,900 Active
-
2025-08-22status Pending
-
2025-08-22historical Contingent
-
2025-08-22historical
-
2025-08-12$99,000 Active
-
2024-07-31historical
-
2024-07-03price $199,900
-
2024-06-03price $208,000
-
2024-05-31price $205,000
-
2024-05-24price $200,000
-
2024-02-14price $205,000
-
2024-01-24price $210,000
-
2024-01-18$229,000 Active
-
2022-11-18soldstatus $200,000 Closed
-
2022-11-18soldstatus $200,000
-
2022-09-25historical Contingent
-
2022-09-15price $209,000
-
2022-07-18$215,000 Active
-
2022-07-18$215,000 Active
-
2022-07-18historical
-
2022-06-16historical
-
2022-01-11price $215,000
-
2021-12-09$269,000 Active
-
1995-07-01soldstatus $35,000
ⓘ Source: listings_history table (triggers on properties + properties_extension) + one-shot
backfill from property_details.listing_events for pre-trigger history.
Tax reassessment forecast KY · Resets to sale price
- Current annual tax
- $2,129 · $177/mo
- Projected year-2 tax
- $2,129 · $177/mo
- Expected delta
- $0/yr ($0/mo · 0.0%)
ⓘ Screening estimate from a state-policy table — verify with the county assessor before closing.
Climate risk First Street
- Flood 7/10 Severe FEMA zone X (unshaded) · 99% chance over 30 yrs
- Wildfire 7/10 Severe
- Heat 4/10 Moderate 7 d/yr ≥99°F today · 19 d/yr by 30 yrs out
- Wind 2/10 Low 4% chance of damaging wind over 30 yrs
- Air quality 2/10 Low 0 unhealthy d/yr today · 1 by 30 yrs out
Nearby sold comps map
Loading sold comps map…
Walkable amenities ~0.75 mi
Loading nearby amenities…
Taxation est. · year 1
- Rental income
- $13,170
- − Mortgage interest
- −$6,996
- − Property taxes
- −$2,129
- − Insurance
- −$1,422
- − Repairs & maintenance
- −$1,054
- − Management
- −$1,054
- − Depreciation
- −$3,633
- Taxable loss
- −$3,118
- Est. tax savings @ 24.0%
- +$748
- After-tax cash flow
- $-258/yr
For passive investors: Depreciation is non-cash, so a rental often shows a tax loss while cash-flowing — sheltering income. Rental losses are passive: they offset passive income freely, and up to $25,000/yr can offset ordinary (W-2) income if you actively participate and your MAGI is under $100k (phasing out to $0 by $150k); unused losses carry forward. On sale, claimed depreciation is recaptured at up to 25%, and gains may owe capital-gains tax (a 1031 exchange can defer both). Figures are a year-1 estimate at your 24.0% rate — not tax advice; consult a CPA.
Schools (NCES district)
- District
- Knox County
- NCES district ID
- 2103150
- Math proficiency
- 24% ▼ -20.00%
- Reading proficiency
- 38% ▼ -19.00%
- Median HH income
- $24,965
- Composite
- 24.59/100
- National rank
- #7636
- State rank
- #116 of 165 in KY
Livability — Corbin
- Score
- 69/100
- State rank
- #179
- US rank
- #8891
Category grades
Schools grade is shown separately in the Schools card above.
Census & demographics
- Population (ZIP)
- 29,767
Population outlook (Knox County) Hauer SSP2
- Today (2025)
- 30,741 people
- By 2030
- 29,887 · -2.8%
- By 2040
- 27,940 · -9.1%
- By 2050
- 25,826 · -16.0%
- By 2075
- 20,895 · -32.0%
- By 2100
- 16,238 · -47.2%
Race, ethnicity, and origin ACS 2023
- Neighborhood character
- Predominantly White (95%)
- Race & ethnicity
- White 95% Two or more races 3% Hispanic / Latino 1%
- Common ancestry
- Serbian 2% Slovak 2% Italian 1%
- Foreign-born
- 1% · Canada
- Languages at home
- 99% English-only · Spanish 1%
Political lean MEDSL · Knox
- 2024 margin
- Solid R (+71.1) · D 13.8% · R 85.0% · Other 1.2%
- 2008→2024 swing
- -26.6pp toward R · 2008: -44.6pp · 2024: -71.1pp
- All cycles
- 2024: R+71.1 2020: R+67.0 2016: R+67.7 2012: R+53.9 2008: R+44.6
Not yet ingested
- Civics
- —
Market trends
- HPI YoY
- ▲ 1.82%
- Current HPI
- 294.7961
- Rent YoY
- —
- Metro
- —
- State GDP YoY
- ▲ 1.81%
- F500 in state
- 4
Industry mix (Fortune 500 HQ in KY)
| Industry | F500 HQs | Revenue |
|---|---|---|
| Healthcare | 1 | $118B |
|
||
| Food / Beverage | 1 | $7B |
|
||
Price history
+256.9% since first listed25 events — show timeline
- 2026-03-28 Pending — ImagineMLS
- 2026-02-06 Listed $124,900 ImagineMLS
- 2025-08-22 Pending — ImagineMLS
- 2025-08-22 Contingent — ImagineMLS
- 2025-08-22 Listing Removed — ImagineMLS
- 2025-08-12 Listed $99,000 ImagineMLS
- 2024-07-31 Listing Removed — ImagineMLS
- 2024-07-03 Price Changed $199,900 ImagineMLS
- 2024-06-03 Price Changed $208,000 ImagineMLS
- 2024-05-31 Price Changed $205,000 ImagineMLS
- 2024-05-24 Price Changed $200,000 ImagineMLS
- 2024-02-14 Price Changed $205,000 ImagineMLS
- 2024-01-24 Price Changed $210,000 ImagineMLS
- 2024-01-18 Listed $229,000 ImagineMLS
- 2022-11-18 Sold (Public Records) $200,000 Public Records
- 2022-11-18 Sold (MLS) $200,000 ImagineMLS
- 2022-09-25 Contingent — ImagineMLS
- 2022-09-15 Price Changed $209,000 ImagineMLS
- 2022-07-18 Listing Removed — ImagineMLS
- 2022-07-18 Listed $215,000 ImagineMLS
- 2022-07-18 Listed $215,000 ImagineMLS
- 2022-06-16 Listing Removed — ImagineMLS
- 2022-01-11 Price Changed $215,000 ImagineMLS
- 2021-12-09 Listed $269,000 ImagineMLS
- 1995-07-01 Sold (Public Records) $35,000 Public Records
Property tax history
+28.4%/yrLatest (2025): $2,129 · +1.7% YoY. Source: county tax records.
Cash-flow waterfall
monthlySold comps — $/sqft
last 12 mo · ≤1 miLoading sold comps…