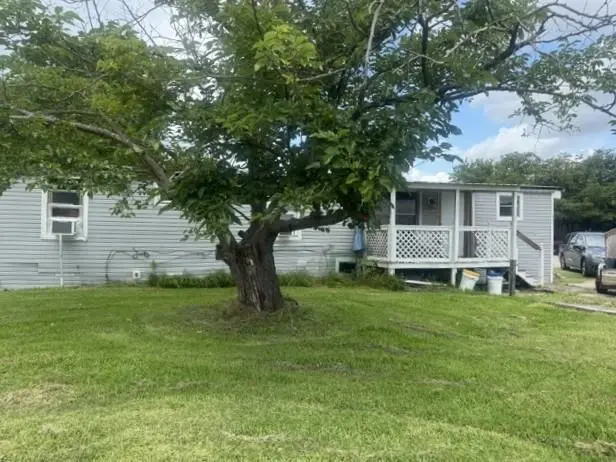
8100 Lakeview Pkwy #15
Rowlett, TX 75088
$25,000D+
2 bd · 1.0 ba ·
784 sqft ·
Built 1981
· Manufactured
· Active
· 1 DOM
Cashflow @ list (25.0% down · 7.5%)
Estimated rent
$1,893/mo
Mortgage (P&I)
−$131
Tax + insurance
−$42
HOA
−$0
Vac / Maint / Mgmt
−$398
Net cashflow
$1,323/mo
Annual
$15,874/yr
Cap rate
69.79%
Cash-on-cash
226.77%
DSCR
11.09
1% rule
7.57%
Cash to close
$7,000
Investor read
- This is a 2-bed/1.0-bath manufactured listed at $25k.
- At list price, monthly cash flow is $1k ($16k/yr) — positive.
- The deal already cash-flows at list — no discount required.
- Meets the 1% rule at list price ($2k rent vs $25k).
- Only 1 days on market — expect competitive offers; lowballing is unlikely to land.
- Local home prices are declining (-3.0%/yr); year-one equity from $173 of loan paydown is wiped out by about $750 of value loss. Plan a longer hold.
- Location reads 75/100 on livability (#147 in TX, #4,150 nationally) — a middle-class / working-renter tenant base. Strengths: employment A+, housing A+, crime A-; Watch: amenities F, commute F, health & safety D-.
- Garland ISD (suburban): math 27% / reading 37% proficiency, ranked #553 of 826 in TX (top 67%) — families likely to look elsewhere, expect single-tenant / working-renter base with shorter leases.
- Zoned schools: Daugherty El (math 22% / reading 29%, grade F, #2,982 of 4,322 statewide, top 70%, 810 students, 94% FRL); B G Hudson Middle (math 33% / reading 42%, grade F, #736 of 1,662 statewide, top 45%, 1,207 students, 50% FRL); Sachse H S (math 46% / reading 53%, grade D, #509 of 1,632 statewide, top 34%, 2,997 students, 43% FRL).
- Market conditions: Rents soft (-1.2%/yr); 300 active listings in the ZIP; 5 comparable units currently listed for rent nearby; rentals leasing fast (median 1d on market — plan ~1-2 weeks tenant-placement turnaround); solid renter incomes; 12,577 units permitted in Dallas County in 2024 (6,829 in 5+ unit buildings).
- Dallas County population projected at +35% by 2050 — long-run rental-demand tailwind backs the buy-and-hold thesis.
- At projected returns (-3.0% appreciation + 0.0% rent growth), your $7k cash investment doubles in ~1 year — after that, you're playing with house money.
- Cap rate 69.8% vs local median 3.1% in Rowlett — top-decile yield for the area; either an underpriced asset or a hidden risk that comps aren't pricing in. Stress-test before assuming the spread holds.
Questions for listing agent
- Is there a deadline driving the sale (1031 exchange, divorce, estate, relocation)? That informs how much negotiation room exists.
- The area grade is low — what's the realistic commute time and amenity access for the typical tenant pool here? Any planned neighborhood developments (good or bad) we should know about?
- What's the average days-on-market for RENTAL listings here right now (not sales)? A rising rental-DOM trend means longer vacancies and softer asking-rent achievability than the comps imply.
- What's the recent tenant-quality profile in this submarket — average credit score on applications, eviction rate, late-payment / NSF rate, and stable-employment percentage? A property-management company in the area should have these aggregated.
- How much new for-sale + rental construction is in the pipeline within 1–3 miles? Heavy new supply typically softens prices + rents 12–24 months out; constrained supply supports both.
CashFlowRE · CFR-MF1RY18VQEGSXC
· Data 1 week ago
cashflowre.app · 2026-05-29