8100 Lakeview Pkwy #15 · Rowlett, TX
Flood risk No data
- FEMA flood zone
- —
- Chance of flooding over 30 yrs
- —
- Est. flood insurance / yr
- —
Fire risk No data
- Est. fire insurance / yr
- —
Heat risk No data
- Hot days now (above threshold)
- —
- Hot days in 30 yrs
- —
Wind risk No data
- Chance of severe wind over 30 yrs
- —
Air-quality risk No data
- Unhealthy air days now
- —
- Unhealthy air days in 30 yrs
- —
Risk factors via First Street. Map © Google.
Why this score? — see what drove the D+ grade
The composite is a weighted blend of 9 inputs, each scored 0–100. Each bar is that input's sub-score; the figure is the points it added to the 100-point composite (weight × sub-score).
- Cash flow +15.0/30.0
- ARV discount +7.5/15.0
- 1% rule +5.0/10.0
- DSCR +5.0/10.0
- Livability +3.8/5.0
- Schools +2.9/10.0
- Condition / age +2.5/5.0
- Rent growth +2.2/5.0
- Appreciation +1.6/10.0
$25,000
🖨 Deal sheet (PDF) 📄 Offer letter ✓ Due diligence
Listing remarks
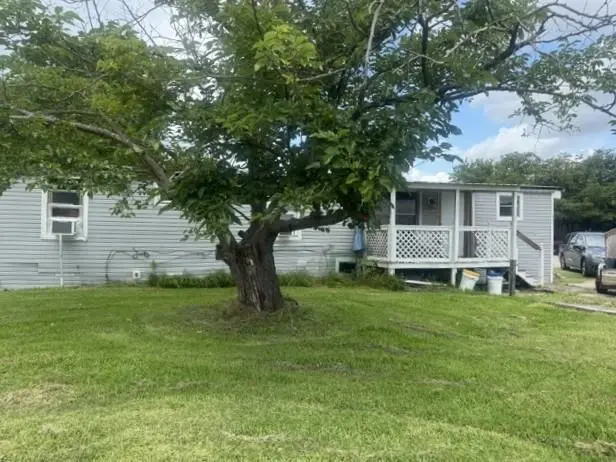
Large grassy lot with shed & trees. Comfortable living while updating your private unit. Close to everything. Garland ISD.
Key facts
- Trees
- Garland isd
- Shed
Tags
Property features AI
Finance
- Other: Property subtype: Mobile Home; Zero lot designation; Will not subdivide
- Financial info: Listing terms include cash and conventional; Second mortgage: No; Loan type: Treat as clear
- HOA & community: No association; Community features: Other
Exterior
- Parking: Driveway (no garage or covered/carport spaces)
- Security: Smoke detector(s)
- Utilities: City water; City sewer; Not in a municipal utility district
- Home design: Mobile home (residential); Entry level: One; Year built: 1981; Preowned
- Construction: Metal roof; Slab foundation
- Exterior features: Covered porch(es); Covered patio/porch; Storage; Few trees; Large backyard with grass; No fencing
Interior
- Kitchen: Eat-in kitchen; Electric range
- Bedrooms: 2 bedrooms (both on the main level)
- Flooring: Luxury vinyl plank flooring
- Bathrooms: 1 full bathroom
- Heating & cooling: Window unit(s) for cooling; No central heating
- Interior features: Cable TV available; One living area; One dining area; Total of 4 rooms; Levels: One
- Laundry & utility: Laundry in hall
Neighborhood map
What this means for you Summary
Snapshot
- This is a 2-bed/1.0-bath manufactured listed at $25k.
Deal economics
- At list price, monthly cash flow is $1k ($16k/yr) — positive.
- The deal already cash-flows at list — no discount required.
- Meets the 1% rule at list price ($2k rent vs $25k).
- Cap rate 69.8% vs local median 3.1% in Rowlett — top-decile yield for the area; either an underpriced asset or a hidden risk that comps aren't pricing in. Stress-test before assuming the spread holds.
Location & tenants
- Location reads 75/100 on livability (#147 in TX, #4,150 nationally) — a middle-class / working-renter tenant base. Strengths: employment A+, housing A+, crime A-; Watch: amenities F, commute F, health & safety D-.
- Garland ISD (suburban): math 27% / reading 37% proficiency, ranked #553 of 826 in TX (top 67%) — families likely to look elsewhere, expect single-tenant / working-renter base with shorter leases.
- Zoned schools: Daugherty El (math 22% / reading 29%, grade F, #2,982 of 4,322 statewide, top 70%, 810 students, 94% FRL); B G Hudson Middle (math 33% / reading 42%, grade F, #736 of 1,662 statewide, top 45%, 1,207 students, 50% FRL); Sachse H S (math 46% / reading 53%, grade D, #509 of 1,632 statewide, top 34%, 2,997 students, 43% FRL).
- Market conditions: Rents soft (-1.2%/yr); 300 active listings in the ZIP; 5 comparable units currently listed for rent nearby; rentals leasing fast (median 1d on market — plan ~1-2 weeks tenant-placement turnaround); solid renter incomes; 12,577 units permitted in Dallas County in 2024 (6,829 in 5+ unit buildings).
Forward outlook
- Local home prices are declining (-3.0%/yr); year-one equity from $173 of loan paydown is wiped out by about $750 of value loss. Plan a longer hold.
- Dallas County population projected at +35% by 2050 — long-run rental-demand tailwind backs the buy-and-hold thesis.
- At projected returns (-3.0% appreciation + 0.0% rent growth), your $7k cash investment doubles in ~1 year — after that, you're playing with house money.
Negotiation context
- Only 1 days on market — expect competitive offers; lowballing is unlikely to land.
Questions for the listing agent
- Is there a deadline driving the sale (1031 exchange, divorce, estate, relocation)? That informs how much negotiation room exists.
- The area grade is low — what's the realistic commute time and amenity access for the typical tenant pool here? Any planned neighborhood developments (good or bad) we should know about?
- What's the average days-on-market for RENTAL listings here right now (not sales)? A rising rental-DOM trend means longer vacancies and softer asking-rent achievability than the comps imply.
- What's the recent tenant-quality profile in this submarket — average credit score on applications, eviction rate, late-payment / NSF rate, and stable-employment percentage? A property-management company in the area should have these aggregated.
- How much new for-sale + rental construction is in the pipeline within 1–3 miles? Heavy new supply typically softens prices + rents 12–24 months out; constrained supply supports both.
Investment metrics
- 1% rule
- 7.57% ✓
- Cap rate
- 69.79%
- Cash-on-cash
- 226.77%
- DSCR
- 11.09
- GRM
- 1.1
CMA / ARV
No comps found within radius.
Projected returns pro-forma
-3.0% appreciation · 0.0% rent growth · sell at horizon
- IRR
- —
- Equity multiple
- 11.67×
- Total profit
- $74,681
- Equity at exit
- $3,728
- IRR
- —
- Equity multiple
- 22.74×
- Total profit
- $152,194
- Equity at exit
- $2,162
Cash invested: $7,000 (down + closing). Projections, not guarantees.
Landlord ↔ Tenant lean methodology
- Overall (STATE)
- 87 Strongly Landlord-Friendly
- State Texas
- 87 Strongly Landlord-Friendly · R+5
- County
- — inherits STATE
- City
- — inherits STATE
ZIP-level market 75088
- Home prices YoY
- -2.0%
- Rents YoY
- -1.2%
- Active inventory
- 300
- Price-to-rent
- 1.1×
Monthly cashflow live
- Estimated rent
- $1,893 high interval (Pro) →
- Mortgage (P&I)
- −$131
- Tax est. 1.5%
- −$31 /mo · $375/yr
- Insurance
- −$10
- HOA
- −$0
- Vacancy / Maint / Mgmt
- −$398
- Net cashflow
- $1,323
Break-even live
Sensitivity live
| Price | -10% $1,340 | -5% $1,331 | +0% $1,323 | +5% $1,314 | +10% $1,306 |
|---|---|---|---|---|---|
| Rent | -10% $1,173 | -5% $1,248 | +0% $1,323 | +5% $1,398 | +10% $1,472 |
| Rate | -1.0pp $1,335 | -0.5pp $1,329 | base $1,323 | +0.5pp $1,316 | +1.0pp $1,310 |
UW: 25.0% down · 7.5% · 30yr · 1.5% tax · 5.0% vac · 8.0% maint · 8.0% mgmt
Financing live
Cash to close
- Down payment
- $6,250
- Closing costs
- $750
- Reserves months
- —
- Total cash needed
- —
Loan-product check · same deal, 3 products live
Conventional
25% down · 7.5% · 30yr
- Down + closing
- —
- Monthly P&I
- —
- Monthly cashflow
- —
- DSCR
- —
- Eligible?
- —
Personal DTI + credit; lowest rate.
DSCR
20% down · 8.5% · 30yr
- Down + closing
- —
- Monthly P&I
- —
- Monthly cashflow
- —
- DSCR
- —
- Eligible?
- —
No personal income docs; deal must DSCR.
Hard money
10% down · 12.0% · 12mo
- Down + closing
- —
- Monthly P&I
- —
- Monthly cashflow
- —
- DSCR
- —
- Eligible?
- —
Short-term bridge; refi at stabilization.
Rent comps 5 comps
| Address | Beds | Baths | Sqft | Rent | $/sqft | DOM | Units | Dist |
|---|---|---|---|---|---|---|---|---|
| 7006 Shipp Rd Unit 1056391P Rowlett, TX | 2.0–8.0 | 1.0–5.5 | 3842 | $3,605 | $0.94 | 0d | 2 | 0.87mi |
| 4205 Dalrock Rd Rowlett, TX | 1.0 | 1.0 | 702 | $1,608 | $2.29 | 7d | 1 | 1.09mi |
| 9701 Terra Lago Ct Rowlett, TX | 3.0 | 1.0–2.0 | 1172 | $1,995 | $1.70 | 0d | 58 | 1.10mi |
| 9035 Minnow Mews Rowlett, TX | 1.0–4.0 | 1.0–2.5 | 1232 | $2,026 | $1.64 | 1d | 15 | 1.20mi |
| 5501 Lakeview Pkwy Rowlett, TX | 1.0–2.0 | 1.0–2.0 | 858 | $1,795 | $2.09 | 7d | 10 | 1.46mi |
Listing history 2 events
-
2026-06-09remarks 124-char remark
-
2026-06-09$25,000 Active 1 DOM
ⓘ Source: listings_history table (triggers on properties + properties_extension) + one-shot
backfill from property_details.listing_events for pre-trigger history.
Nearby sold comps map
Loading sold comps map…
Walkable amenities ~0.75 mi
Loading nearby amenities…
Taxation est. · year 1
- Rental income
- $22,718
- − Mortgage interest
- −$1,400
- − Property taxes
- −$375
- − Insurance
- −$125
- − Repairs & maintenance
- −$1,817
- − Management
- −$1,817
- − Depreciation
- −$727
- Taxable income
- $16,455
- Est. tax owed @ 24.0%
- −$3,949
- After-tax cash flow
- $11,925/yr
For passive investors: Depreciation is non-cash, so a rental often shows a tax loss while cash-flowing — sheltering income. Rental losses are passive: they offset passive income freely, and up to $25,000/yr can offset ordinary (W-2) income if you actively participate and your MAGI is under $100k (phasing out to $0 by $150k); unused losses carry forward. On sale, claimed depreciation is recaptured at up to 25%, and gains may owe capital-gains tax (a 1031 exchange can defer both). Figures are a year-1 estimate at your 24.0% rate — not tax advice; consult a CPA.
Schools (NCES district)
- District
- Garland ISD
- NCES district ID
- 4820340
- Math proficiency
- 27% ▼ -23.00%
- Reading proficiency
- 37% ▼ -10.00%
- Median HH income
- $58,392
- Composite
- 28.63/100
- National rank
- #6706
- State rank
- #553 of 826 in TX
Livability — Rowlett
- Score
- 75/100
- State rank
- #147
- US rank
- #4150
Category grades
Schools grade is shown separately in the Schools card above.
Census & demographics
- Census place
- Rowlett, TX
- County
- Dallas County · 2,612,404 people
- City population
- 35,619
- Metro
- Dallas-Fort Worth-Arlington, TX
- Population (ZIP)
- 28,075
- Household income
- $105,313
- Rent vs Own
- Severe rent burden
- 626.0
Population outlook (Dallas County) Hauer SSP2
- Today (2025)
- 2,979,839 people
- By 2030
- 3,191,823 · +7.1%
- By 2040
- 3,619,611 · +21.5%
- By 2050
- 4,026,915 · +35.1%
- By 2075
- 4,957,073 · +66.4%
- By 2100
- 5,508,725 · +84.9%
Race, ethnicity, and origin ACS 2023
- Neighborhood character
- Diverse neighborhood (Simpson 0.62)
- Race & ethnicity
- White 56% Hispanic / Latino 19% Black 18% Two or more races 10% Asian 4%
- Hispanic origin (detail)
- Mexican 15%
- Common ancestry
- Slovak 3% Italian 2% Romanian 2%
- Foreign-born
- 10% · Canada, Vietnam
- Languages at home
- 84% English-only · Spanish 11% Other Indo-European 1% Other Asian/Pacific 1%
Political lean MEDSL · Dallas
- 2024 margin
- Strong D (+22.2) · D 60.2% · R 38.0% · Other 1.8%
- 2008→2024 swing
- +6.9pp toward D · 2008: 15.3pp · 2024: 22.2pp
- All cycles
- 2024: D+22.2 2020: D+31.6 2016: D+26.2 2012: D+15.4 2008: D+15.3
Not yet ingested
- Civics
- —
Market trends
- HPI YoY
- ▼ -6.72%
- Current HPI
- 328.27
- Rent YoY
- ▼ -1.22%
- Metro
- Dallas-Fort Worth-Arlington, TX
- State GDP YoY
- ▲ 3.95%
- F500 in state
- 110
Industry mix (Fortune 500 HQ in TX)
| Industry | F500 HQs | Revenue |
|---|---|---|
| Energy | 16 | $1,198B |
|
||
| Technology | 5 | $198B |
|
||
| Engineering / Construction | 4 | $72B |
|
||
| Energy Services | 3 | $60B |
|
||
| Utilities | 3 | $41B |
|
||
| Healthcare | 2 | $330B |
|
||
Price history
1 event — show timeline
- 2026-06-08 Listed $25,000 NTREIS
Property tax history
-6.4%/yrLatest (2025): $13 · +6.7% YoY. Source: county tax records.
Cash-flow waterfall
monthlySold comps — $/sqft
last 12 mo · ≤1 miLoading sold comps…