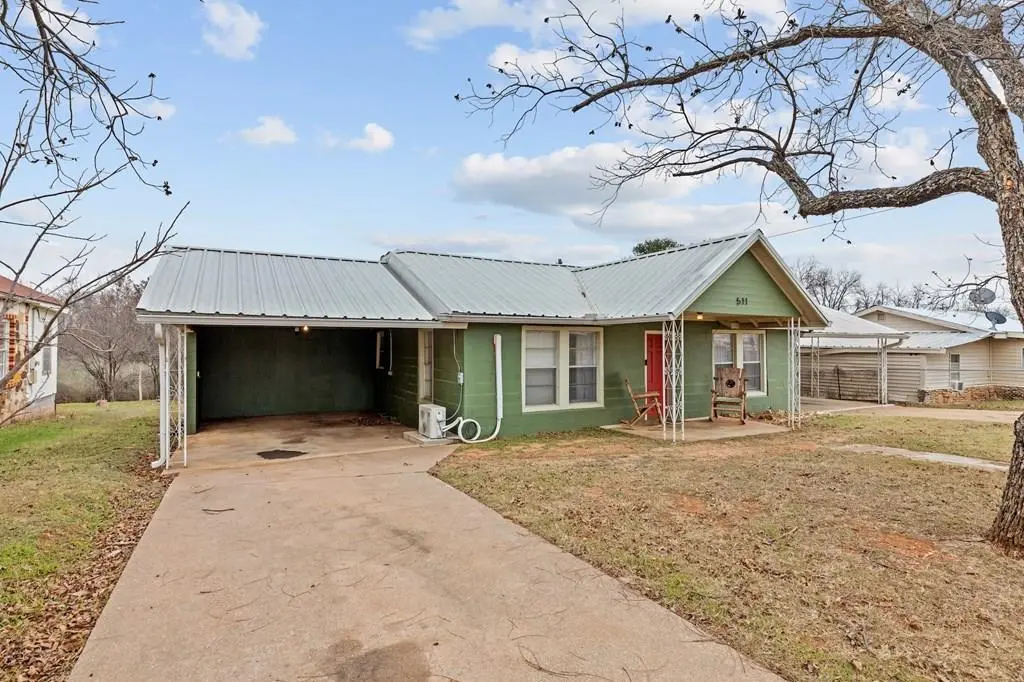
511 S Live Oak St
Mason, TX 76856
$175,000D
3 bd · 1.0 ba ·
1,248 sqft ·
Built 1947
· SingleFamily
· Active
· 2 DOM
Cashflow @ list (25.0% down · 7.5%)
Estimated rent
$969/mo
Mortgage (P&I)
−$918
Tax + insurance
−$268
HOA
−$0
Vac / Maint / Mgmt
−$203
Net cashflow
$-421/mo
Annual
$-5,048/yr
Cap rate
3.41%
Cash-on-cash
-10.30%
DSCR
0.54
1% rule
0.55%
Cash to close
$49,000
Investor read
- This is a 3-bed/1.0-bath single-family listed at $175k.
- At list price, monthly cash flow is $-421 ($-5k/yr) — negative.
- To cash-flow at today's rent, offer at most $101k (42.5% below list).
- To meet the 1% rule (rent ≥ 1% of price), the offer needs to be $97k (44.7% below list).
- Only 2 days on market — expect competitive offers; lowballing is unlikely to land.
- Recommended offer: $97k (44.7% below list) — sets the bar for 1% rule.
- In year one you build about $9k of equity ($1k loan paydown + $8k appreciation (4.6% local appreciation)).
- Location reads 65/100 on livability (#662 in TX) — a middle-class / working-renter tenant base. Strengths: crime A+, cost of living A+, housing A+; Watch: amenities F, commute F, employment F.
- Mason ISD (rural): math 57% / reading 63% proficiency, ranked #76 of 826 in TX (top 9%) — acceptable for families but not a draw, mixed tenant base, ~2y average lease.
- Zoned schools: Mason El (math 57% / reading 57%, grade C+, #505 of 4,322 statewide, top 13%, 291 students, 50% FRL); Mason J H (math 52% / reading 62%, grade B, #212 of 1,662 statewide, top 13%, 204 students, 48% FRL); Mason H S (math 72% / reading 64%, grade B, #147 of 1,632 statewide, top 9%, 214 students, 42% FRL) — zoned schools at 47% FRL track the district average.
- Watch-outs: built in 1947 — expect roof / HVAC / electrical / plumbing capex.
- Market conditions: 99 active listings in the ZIP; 4 units permitted in Mason County in 2024 (0 in 5+ unit buildings).
- Mason County population projected to shrink 4% by 2050 — rents likely to lag national; underwrite the cash flow, not the appreciation.
- 3 sale attempts since 6y ago with the ask held roughly flat each time — persistent listings suggest the price (not the market) is what's stuck; bring a comps-based counter.
- By year 4, paydown + projected appreciation supports a ~$31k cash-out refi (75% LTV) — recoverable capital for the next deal without selling this one.
- Climate carrying-cost: major wind risk, 27% chance of damaging wind over 30y; major wildfire risk; extreme-heat days projected 6→19/yr by 2055 (HVAC capex compounding) — expect insurance premiums to compound above CPI over the hold.
Questions for listing agent
- What do current leases actually rent for vs. the listed asking? Can we see a recent rent roll and the last 12 months of T-12 income?
- Built in 1947 — when were the roof, HVAC, electrical panel, plumbing, and water heater last replaced?
- Is there a deadline driving the sale (1031 exchange, divorce, estate, relocation)? That informs how much negotiation room exists.
- The area grade is low — what's the realistic commute time and amenity access for the typical tenant pool here? Any planned neighborhood developments (good or bad) we should know about?
- What's the average days-on-market for RENTAL listings here right now (not sales)? A rising rental-DOM trend means longer vacancies and softer asking-rent achievability than the comps imply.
- What's the recent tenant-quality profile in this submarket — average credit score on applications, eviction rate, late-payment / NSF rate, and stable-employment percentage? A property-management company in the area should have these aggregated.
- How much new for-sale + rental construction is in the pipeline within 1–3 miles? Heavy new supply typically softens prices + rents 12–24 months out; constrained supply supports both.
CashFlowRE · CFR-MFQHK13QTADMY6
· Data 9 h ago
cashflowre.app · 2026-05-29