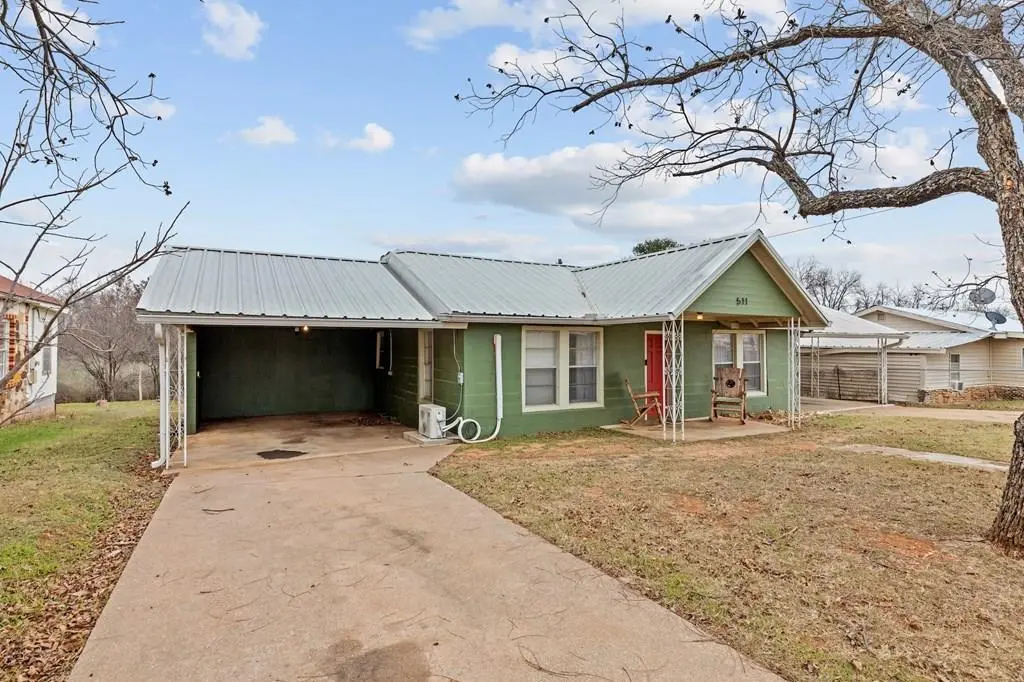
511 S Live Oak St · Mason, TX
Flood risk 1/10 · Minimal
- FEMA flood zone
- —
- Chance of flooding over 30 yrs
- 0.0%
- Est. flood insurance / yr
- —
Fire risk 7/10 · Major
- Est. fire insurance / yr
- $1,222 – $2,270
Heat risk 7/10 · Major
- Hot days now (above 104°F)
- 6 days/yr
- Hot days in 30 yrs
- 19 days/yr
Wind risk 6/10 · Moderate
- Chance of severe wind over 30 yrs
- 27.0%
Air-quality risk 1/10 · Minimal
- Unhealthy air days now
- 0 days/yr
- Unhealthy air days in 30 yrs
- 0 days/yr
Risk factors via First Street. Map © Google.
Why this score? — see what drove the D grade
The composite is a weighted blend of 9 inputs, each scored 0–100. Each bar is that input's sub-score; the figure is the points it added to the 100-point composite (weight × sub-score).
- ARV discount +15.0/15.0
- Appreciation +7.3/10.0
- Schools +5.0/10.0
- Cash flow +4.9/30.0
- Livability +3.2/5.0
- Rent growth +2.5/5.0
- Condition / age +2.5/5.0
- 1% rule +0.5/10.0
- DSCR +0.0/10.0
$175,000
🖨 Deal sheet (PDF) 📄 Offer letter ✓ Due diligence
Listing remarks MLS
Atttractive three bedroom home with two baths and two large carports. Home has been up-dated with decorative accents. Convenient to Mason Square and located in highly rated Mason school district. Large walk in pantry. Lots of closets and storage areas. Large fenced back yard. Nicely landscaped front yard. Heat and air are mini splits.
Key facts
- Metal roof
- Ample cabinetry
- Two-car carport
Tags
Property features AI
Exterior
- Parking: Attached concrete parking
- Utilities: Public sewer
- Home design: Single-family residence; Cottage/Traditional style; 1 story
- Construction: Block construction; Metal roof
- Exterior features: Level lot; Publicly maintained road access
Interior
- Kitchen: Dishwasher; Microwave; Range; Refrigerator
- Flooring: Tile; Vinyl
- Bathrooms: 2 full bathrooms
- Heating & cooling: Propane heating; Ceiling fans; Window air conditioning unit(s); Wall air conditioning unit(s)
- Interior features: Walk-in closet
Neighborhood map
What this means for you Summary
Snapshot
- This is a 3-bed/1.0-bath single-family listed at $175k.
Deal economics
- At list price, monthly cash flow is $-421 ($-5k/yr) — negative.
- To cash-flow at today's rent, offer at most $101k (42.5% below list).
- To meet the 1% rule (rent ≥ 1% of price), the offer needs to be $97k (44.7% below list).
- Recommended offer: $97k (44.7% below list) — sets the bar for 1% rule.
Location & tenants
- Location reads 65/100 on livability (#662 in TX) — a middle-class / working-renter tenant base. Strengths: crime A+, cost of living A+, housing A+; Watch: amenities F, commute F, employment F.
- Mason ISD (rural): math 57% / reading 63% proficiency, ranked #76 of 826 in TX (top 9%) — acceptable for families but not a draw, mixed tenant base, ~2y average lease.
- Zoned schools: Mason El (math 57% / reading 57%, grade C+, #505 of 4,322 statewide, top 13%, 291 students, 50% FRL); Mason J H (math 52% / reading 62%, grade B, #212 of 1,662 statewide, top 13%, 204 students, 48% FRL); Mason H S (math 72% / reading 64%, grade B, #147 of 1,632 statewide, top 9%, 214 students, 42% FRL) — zoned schools at 47% FRL track the district average.
- Market conditions: 99 active listings in the ZIP; 4 units permitted in Mason County in 2024 (0 in 5+ unit buildings).
Forward outlook
- In year one you build about $9k of equity ($1k loan paydown + $8k appreciation (4.6% local appreciation)).
- Mason County population projected to shrink 4% by 2050 — rents likely to lag national; underwrite the cash flow, not the appreciation.
- By year 4, paydown + projected appreciation supports a ~$31k cash-out refi (75% LTV) — recoverable capital for the next deal without selling this one.
Negotiation context
- Only 2 days on market — expect competitive offers; lowballing is unlikely to land.
- 3 sale attempts since 6y ago with the ask held roughly flat each time — persistent listings suggest the price (not the market) is what's stuck; bring a comps-based counter.
Risks & watch-outs
- Watch-outs: built in 1947 — expect roof / HVAC / electrical / plumbing capex.
- Climate carrying-cost: major wind risk, 27% chance of damaging wind over 30y; major wildfire risk; extreme-heat days projected 6→19/yr by 2055 (HVAC capex compounding) — expect insurance premiums to compound above CPI over the hold.
Questions for the listing agent
- What do current leases actually rent for vs. the listed asking? Can we see a recent rent roll and the last 12 months of T-12 income?
- Built in 1947 — when were the roof, HVAC, electrical panel, plumbing, and water heater last replaced?
- Is there a deadline driving the sale (1031 exchange, divorce, estate, relocation)? That informs how much negotiation room exists.
- The area grade is low — what's the realistic commute time and amenity access for the typical tenant pool here? Any planned neighborhood developments (good or bad) we should know about?
- What's the average days-on-market for RENTAL listings here right now (not sales)? A rising rental-DOM trend means longer vacancies and softer asking-rent achievability than the comps imply.
- What's the recent tenant-quality profile in this submarket — average credit score on applications, eviction rate, late-payment / NSF rate, and stable-employment percentage? A property-management company in the area should have these aggregated.
- How much new for-sale + rental construction is in the pipeline within 1–3 miles? Heavy new supply typically softens prices + rents 12–24 months out; constrained supply supports both.
Investment metrics
- 1% rule
- 0.55% ✗
- Cap rate
- 3.41%
- Cash-on-cash
- -10.30%
- DSCR
- 0.54
- GRM
- 15.1
CMA / ARV
- ARV (median comp)
- $267,894
- List price
- $175,000
- Delta
- -34.68%
- Verdict
- UNDERPRICED
- Comps
- 6 within 1.0 mi
Projected returns pro-forma
4.62% appreciation · 3.0% rent growth · sell at horizon
- IRR
- 3.1%
- Equity multiple
- 1.20×
- Total profit
- $9,793
- Equity at exit
- $95,181
- IRR
- 6.1%
- Equity multiple
- 2.12×
- Total profit
- $54,654
- Equity at exit
- $161,062
Cash invested: $49,000 (down + closing). Projections, not guarantees.
Landlord ↔ Tenant lean methodology
- Overall (STATE)
- 87 Strongly Landlord-Friendly
- State Texas
- 87 Strongly Landlord-Friendly · R+5
- County
- — inherits STATE
- City
- — inherits STATE
ZIP-level market 76856
- Home prices YoY
- 2.3%
- Active inventory
- 99
- Price-to-rent
- 15.1×
Monthly cashflow live
- Estimated rent
- $969 medium interval (Pro) →
- Mortgage (P&I)
- −$918
- Tax from tax record
- −$195 /mo · $2,342/yr
- Insurance
- −$73
- HOA
- −$0
- Vacancy / Maint / Mgmt
- −$203
- Net cashflow
- $-421
Break-even live
Sensitivity live
| Price | -10% $-322 | -5% $-371 | +0% $-421 | +5% $-470 | +10% $-520 |
|---|---|---|---|---|---|
| Rent | -10% $-497 | -5% $-459 | +0% $-421 | +5% $-382 | +10% $-344 |
| Rate | -1.0pp $-333 | -0.5pp $-376 | base $-421 | +0.5pp $-466 | +1.0pp $-512 |
UW: 25.0% down · 7.5% · 30yr · 1.5% tax · 5.0% vac · 8.0% maint · 8.0% mgmt
Financing live
Cash to close
- Down payment
- $43,750
- Closing costs
- $5,250
- Reserves months
- —
- Total cash needed
- —
Loan-product check · same deal, 3 products live
Conventional
25% down · 7.5% · 30yr
- Down + closing
- —
- Monthly P&I
- —
- Monthly cashflow
- —
- DSCR
- —
- Eligible?
- —
Personal DTI + credit; lowest rate.
DSCR
20% down · 8.5% · 30yr
- Down + closing
- —
- Monthly P&I
- —
- Monthly cashflow
- —
- DSCR
- —
- Eligible?
- —
No personal income docs; deal must DSCR.
Hard money
10% down · 12.0% · 12mo
- Down + closing
- —
- Monthly P&I
- —
- Monthly cashflow
- —
- DSCR
- —
- Eligible?
- —
Short-term bridge; refi at stabilization.
Listing history 25 events
-
2026-06-22days on market $175,000 Active 2 DOM
-
2026-06-19days on market $175,000 Active 164 DOM
-
2026-06-18days on market $175,000 Active 163 DOM
-
2026-06-17days on market $175,000 Active 162 DOM
-
2026-06-16days on market $175,000 Active 161 DOM
-
2026-06-15days on market $175,000 Active 160 DOM
-
2026-06-14days on market $175,000 Active 158 DOM
-
2026-06-12days on market $175,000 Active 157 DOM
-
2026-06-09days on market $175,000 Active 154 DOM
-
2026-06-08days on market $175,000 Active 153 DOM
-
2026-06-07days on market $175,000 Active 152 DOM
-
2026-06-07days on market $175,000 Active 151 DOM
-
2026-06-03days on market $175,000 Active 148 DOM
-
2026-06-02days on market $175,000 Active 147 DOM
-
2026-06-01days on market $175,000 Active 146 DOM
-
2026-05-31days on market $175,000 Active 145 DOM
-
2026-05-30days on market $175,000 Active 144 DOM
-
2026-05-15price $198,000 1222-char remark
-
2026-04-14price $210,995 1222-char remark
-
2026-03-15price $220,995 1222-char remark
-
2026-03-05price $229,995 1222-char remark
-
2026-01-06$239,995 Active 1222-char remark
-
2020-12-02soldstatus 336-char remark
Show marketing remark (336 chars)
Atttractive three bedroom home with two baths and two large carports. Home has been up-dated with decorative accents. Convenient to Mason Square and located in highly rated Mason school district. Large walk in pantry. Lots of closets and storage areas. Large fenced back yard. Nicely landscaped front yard. Heat and air are mini splits.
-
2020-05-12soldstatus
-
2020-03-18$154,000 336-char remark
Show marketing remark (336 chars)
Atttractive three bedroom home with two baths and two large carports. Home has been up-dated with decorative accents. Convenient to Mason Square and located in highly rated Mason school district. Large walk in pantry. Lots of closets and storage areas. Large fenced back yard. Nicely landscaped front yard. Heat and air are mini splits.
ⓘ Source: listings_history table (triggers on properties + properties_extension) + one-shot
backfill from property_details.listing_events for pre-trigger history.
Tax reassessment forecast TX · Resets to sale price
- Current annual tax
- $2,342 · $195/mo
- Projected year-2 tax
- $3,202 · $267/mo
- Expected delta
- +$860/yr (+$72/mo · 36.7%)
ⓘ Screening estimate from a state-policy table — verify with the county assessor before closing.
Climate risk First Street
- Flood 1/10 Low 0% chance over 30 yrs
- Wildfire 7/10 Severe
- Heat 7/10 Severe 6 d/yr ≥104°F today · 19 d/yr by 30 yrs out
- Wind 6/10 Major 27% chance of damaging wind over 30 yrs
- Air quality 1/10 Low 0 unhealthy d/yr today · 0 by 30 yrs out
Nearby sold comps map
Loading sold comps map…
Walkable amenities ~0.75 mi
Loading nearby amenities…
Taxation est. · year 1
- Rental income
- $11,623
- − Mortgage interest
- −$9,803
- − Property taxes
- −$2,342
- − Insurance
- −$875
- − Repairs & maintenance
- −$930
- − Management
- −$930
- − Depreciation
- −$5,091
- Taxable loss
- −$8,348
- Est. tax savings @ 24.0%
- +$2,003
- After-tax cash flow
- $-3,044/yr
For passive investors: Depreciation is non-cash, so a rental often shows a tax loss while cash-flowing — sheltering income. Rental losses are passive: they offset passive income freely, and up to $25,000/yr can offset ordinary (W-2) income if you actively participate and your MAGI is under $100k (phasing out to $0 by $150k); unused losses carry forward. On sale, claimed depreciation is recaptured at up to 25%, and gains may owe capital-gains tax (a 1031 exchange can defer both). Figures are a year-1 estimate at your 24.0% rate — not tax advice; consult a CPA.
Schools (NCES district)
- District
- Mason ISD
- NCES district ID
- 4829280
- Math proficiency
- 57% ▲ 2.00%
- Reading proficiency
- 63% ▲ 1.00%
- Median HH income
- $40,797
- Composite
- 50.18/100
- National rank
- #1898
- State rank
- #76 of 826 in TX
Livability — Mason
- Score
- 65/100
- State rank
- #662
- US rank
- #12456
Category grades
Schools grade is shown separately in the Schools card above.
Census & demographics
- Census place
- Mason, TX
- Population (ZIP)
- 3,525
Population outlook (Mason County) Hauer SSP2
- Today (2025)
- 3,979 people
- By 2030
- 3,930 · -1.2%
- By 2040
- 3,836 · -3.6%
- By 2050
- 3,838 · -3.5%
- By 2075
- 4,230 · +6.3%
- By 2100
- 4,260 · +7.1%
Race, ethnicity, and origin ACS 2023
- Neighborhood character
- Predominantly White (76%)
- Race & ethnicity
- White 76% Hispanic / Latino 23% Two or more races 8%
- Hispanic origin (detail)
- Mexican 23%
- Common ancestry
- Lithuanian 4% Slovak 2% Italian 2%
- Foreign-born
- 4% · Canada
- Languages at home
- 81% English-only · Spanish 18% Other Indo-European 1%
Political lean MEDSL · Mason
- 2024 margin
- Solid R (+65.0) · D 17.2% · R 82.2%
- 2008→2024 swing
- -18.0pp toward R · 2008: -47.1pp · 2024: -65.0pp
- All cycles
- 2024: R+65.0 2020: R+62.0 2016: R+63.5 2012: R+60.1 2008: R+47.1
Not yet ingested
- Civics
- —
Market trends
- HPI YoY
- ▲ 4.62%
- Current HPI
- 206.7593
- Rent YoY
- —
- Metro
- —
- State GDP YoY
- ▲ 3.95%
- F500 in state
- 110
Industry mix (Fortune 500 HQ in TX)
| Industry | F500 HQs | Revenue |
|---|---|---|
| Energy | 16 | $1,198B |
|
||
| Technology | 5 | $198B |
|
||
| Engineering / Construction | 4 | $72B |
|
||
| Energy Services | 3 | $60B |
|
||
| Utilities | 3 | $41B |
|
||
| Healthcare | 2 | $330B |
|
||
Price history
+13.6% since first listed10 events — show timeline
- 2026-06-20 Listed $175,000 CHCMLS
- 2026-05-28 Price Changed $175,000 CHCMLS
- 2026-05-15 Price Changed $198,000 CHCMLS
- 2026-04-14 Price Changed $210,995 CHCMLS
- 2026-03-15 Price Changed $220,995 CHCMLS
- 2026-03-05 Price Changed $229,995 CHCMLS
- 2026-01-06 Listed $239,995 CHCMLS
- 2020-12-02 Sold (MLS) — CHCMLS
- 2020-05-12 Sold (Public Records) — Public Records
- 2020-03-18 Listed $154,000 CHCMLS
Property tax history
+6.7%/yrLatest (2025): $2,342 · -11.0% YoY. Source: county tax records.
Cash-flow waterfall
monthlySold comps — $/sqft
last 12 mo · ≤1 miLoading sold comps…