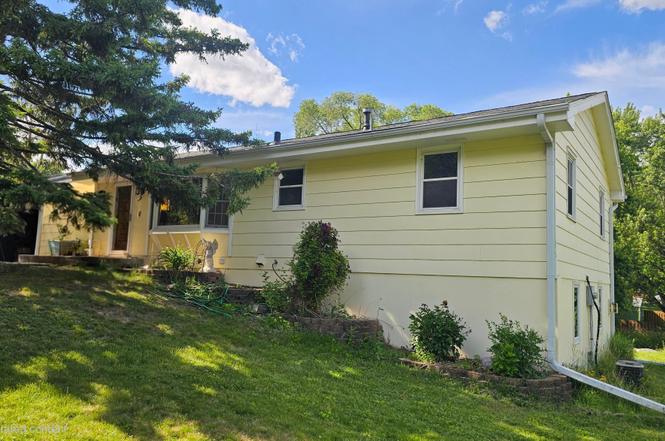
13900 63rd Ave N
Maple Grove, MN 55311
$219,900C
3 bd · 2.0 ba ·
1,554 sqft ·
Built 1960
· SingleFamily
· Coming Soon
· 1 DOM
Cashflow @ list (25.0% down · 7.5%)
Estimated rent
$2,472/mo
Mortgage (P&I)
−$1,153
Tax + insurance
−$378
HOA
−$0
Vac / Maint / Mgmt
−$519
Net cashflow
$422/mo
Annual
$5,061/yr
Cap rate
8.59%
Cash-on-cash
8.22%
DSCR
1.37
1% rule
1.12%
Cash to close
$61,572
Investor read
- This is a 3-bed/2.0-bath single-family listed at $220k.
- At list price, monthly cash flow is $422 ($5k/yr) — positive.
- The deal already cash-flows at list — no discount required.
- Meets the 1% rule at list price ($2k rent vs $220k).
- Only 1 days on market — expect competitive offers; lowballing is unlikely to land.
- Local home prices are declining (-3.0%/yr); year-one equity from $2k of loan paydown is wiped out by about $7k of value loss. Plan a longer hold.
- Location reads 81/100 on livability (#54 in MN, #1,353 nationally) — a professional / high-income tenant draw. Strengths: commute A+, employment A+, housing A+; Watch: amenities D, cost of living D.
- Osseo Public School District (suburban): math 42% / reading 51% proficiency, ranked #129 of 301 in MN (top 43%) — families likely to look elsewhere, expect single-tenant / working-renter base with shorter leases.
- Market conditions: Rents rising fast (+5.9%/yr); 300 active listings in the ZIP; 9 comparable units currently listed for rent nearby; rentals leasing fast (median 3d on market — plan ~1-2 weeks tenant-placement turnaround); high-income renter base; 4,651 units permitted in Hennepin County in 2024 (2,443 in 5+ unit buildings).
- Hennepin County population projected at +30% by 2050 — long-run rental-demand tailwind backs the buy-and-hold thesis.
- 2 sale attempts since 33y ago; this cycle's ask is 137% above the opening price — seller raised mid-cycle; expect resistance to lowballs.
- Current owner paid $89k; list at $220k implies a 147% gain — meaningful room to come down on a strong offer.
- At projected returns (-3.0% appreciation + 5.9% rent growth), your $62k cash investment doubles in ~9 years — after that, you're playing with house money.
- Cap rate 8.6% vs local median 3.4% in Maple Grove — top-decile yield for the area; either an underpriced asset or a hidden risk that comps aren't pricing in. Stress-test before assuming the spread holds.
Questions for listing agent
- Built in 1960 — when were the roof, HVAC, electrical panel, plumbing, and water heater last replaced?
- Is there a deadline driving the sale (1031 exchange, divorce, estate, relocation)? That informs how much negotiation room exists.
- Schools are A-rated — typically a magnet for longer-tenancy family renters. What's the average tenant stay here, and is there a school-zone premium baked into asking?
- What's the average days-on-market for RENTAL listings here right now (not sales)? A rising rental-DOM trend means longer vacancies and softer asking-rent achievability than the comps imply.
- What's the recent tenant-quality profile in this submarket — average credit score on applications, eviction rate, late-payment / NSF rate, and stable-employment percentage? A property-management company in the area should have these aggregated.
- How much new for-sale + rental construction is in the pipeline within 1–3 miles? Heavy new supply typically softens prices + rents 12–24 months out; constrained supply supports both.
CashFlowRE · CFR-MGCJS85N9TF6XT
· Data 2 days ago
cashflowre.app · 2026-05-29