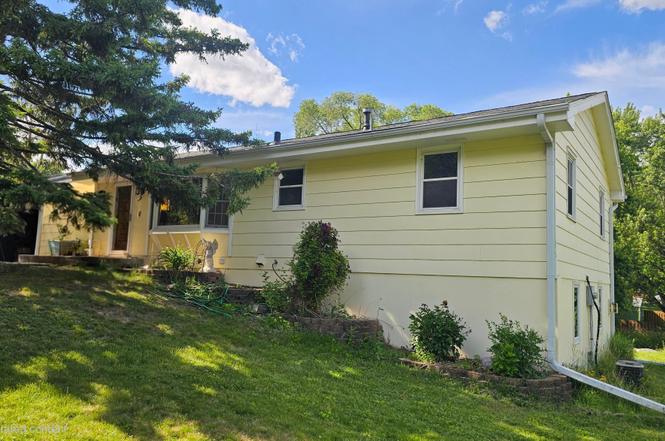
13900 63rd Ave N · Maple Grove, MN
Flood risk 1/10 · Minimal
- FEMA flood zone
- X (unshaded)
- Chance of flooding over 30 yrs
- 0.0%
- Est. flood insurance / yr
- $473 – $860
Fire risk 1/10 · Minimal
- Est. fire insurance / yr
- $888 – $1,650
Heat risk 2/10 · Minimal
- Hot days now (above 99°F)
- 7 days/yr
- Hot days in 30 yrs
- 13 days/yr
Wind risk 2/10 · Minimal
- Chance of severe wind over 30 yrs
- —
Air-quality risk 2/10 · Minimal
- Unhealthy air days now
- 1 days/yr
- Unhealthy air days in 30 yrs
- 1 days/yr
Risk factors via First Street. Map © Google.
Why this score? — see what drove the C grade
The composite is a weighted blend of 9 inputs, each scored 0–100. Each bar is that input's sub-score; the figure is the points it added to the 100-point composite (weight × sub-score).
- Cash flow +23.8/30.0
- DSCR +7.7/10.0
- ARV discount +7.5/15.0
- 1% rule +6.2/10.0
- Schools +4.2/10.0
- Rent growth +4.0/5.0
- Livability +4.0/5.0
- Condition / age +2.5/5.0
- Appreciation +0.0/10.0
$219,900
🖨 Deal sheet 📄 Offer letter ✓ Due diligence
Listing remarks
Unleash the Potential: Incredible Sweat Equity Opportunity in Maple Grove! Whether you are a first-time homebuyer looking to stop paying rent and start building equity or a seasoned investor searching for your next high-margin project, this property is the golden ticket you’ve been waiting for. Situated on a highly desirable walk-out corner lot in a competitive, high-demand Maple Grove neighborhood, the foundation for a spectacular home is already here. Just across the street, you’ll find a serene natural habitat and a peaceful trail system—giving you a picturesque backdrop and an unbeatable location advantage. This property is a true diamond in the rough, brimming with fi
Key facts
- Hard wood floors
- Premium corner lot
- Walk-out corner lot
Tags
Property features AI
Exterior
- Parking: Attached 2-car garage with 8-ft garage door
- Utilities: City water connected; City sewer connected; Natural gas; 150 amp electrical service
- Home design: Residential property; One level (main living on one level) with lower level walkout
- Construction: Built with block and frame construction; Foundation: block and wood; Asphalt roof (age over 8 years)
- Exterior features: Patio; Corner lot; City street frontage; Publicly maintained road
Interior
- Kitchen: Eat-in kitchen; Range; Microwave; Refrigerator; Dishwasher
- Bedrooms: 4 bedrooms total; Main level bedrooms include Bedroom, Bedroom 2, Bedroom 3; Lower level bedroom (Bedroom 4)
- Bathrooms: One full bath on the main floor; One 3/4 bath in the basement
- Heating & cooling: Forced air heating; Central air conditioning
- Interior features: Finished basement with walkout; Block basement; Gas fireplace; Eat-in kitchen; 3 bedrooms on one level (main floor bedroom); Family room on lower level; Storage room in lower level
- Laundry & utility: Laundry located on lower level; Washer and dryer included
Neighborhood map
What this means for you Summary
Snapshot
- This is a 3-bed/2.0-bath single-family listed at $220k.
Deal economics
- At list price, monthly cash flow is $422 ($5k/yr) — positive.
- The deal already cash-flows at list — no discount required.
- Meets the 1% rule at list price ($2k rent vs $220k).
- Cap rate 8.6% vs local median 3.4% in Maple Grove — top-decile yield for the area; either an underpriced asset or a hidden risk that comps aren't pricing in. Stress-test before assuming the spread holds.
Location & tenants
- Location reads 81/100 on livability (#54 in MN, #1,353 nationally) — a professional / high-income tenant draw. Strengths: commute A+, employment A+, housing A+; Watch: amenities D, cost of living D.
- Osseo Public School District (suburban): math 42% / reading 51% proficiency, ranked #129 of 301 in MN (top 43%) — families likely to look elsewhere, expect single-tenant / working-renter base with shorter leases.
- Market conditions: Rents rising fast (+5.9%/yr); 300 active listings in the ZIP; 9 comparable units currently listed for rent nearby; rentals leasing fast (median 2d on market — plan ~1-2 weeks tenant-placement turnaround); high-income renter base; 4,651 units permitted in Hennepin County in 2024 (2,443 in 5+ unit buildings).
Forward outlook
- Local home prices are declining (-3.0%/yr); year-one equity from $2k of loan paydown is wiped out by about $7k of value loss. Plan a longer hold.
- Hennepin County population projected at +30% by 2050 — long-run rental-demand tailwind backs the buy-and-hold thesis.
- At projected returns (-3.0% appreciation + 5.9% rent growth), your $62k cash investment doubles in ~9 years — after that, you're playing with house money.
Negotiation context
- Only 1 days on market — expect competitive offers; lowballing is unlikely to land.
- 2 sale attempts since 33y ago; this cycle's ask is 137% above the opening price — seller raised mid-cycle; expect resistance to lowballs.
- Current owner paid $89k; list at $220k implies a 147% gain — meaningful room to come down on a strong offer.
Questions for the listing agent
- Built in 1960 — when were the roof, HVAC, electrical panel, plumbing, and water heater last replaced?
- Is there a deadline driving the sale (1031 exchange, divorce, estate, relocation)? That informs how much negotiation room exists.
- Schools are A-rated — typically a magnet for longer-tenancy family renters. What's the average tenant stay here, and is there a school-zone premium baked into asking?
- What's the average days-on-market for RENTAL listings here right now (not sales)? A rising rental-DOM trend means longer vacancies and softer asking-rent achievability than the comps imply.
- What's the recent tenant-quality profile in this submarket — average credit score on applications, eviction rate, late-payment / NSF rate, and stable-employment percentage? A property-management company in the area should have these aggregated.
- How much new for-sale + rental construction is in the pipeline within 1–3 miles? Heavy new supply typically softens prices + rents 12–24 months out; constrained supply supports both.
Investment metrics
- 1% rule
- 1.12% ✓
- Cap rate
- 8.59%
- Cash-on-cash
- 8.22%
- DSCR
- 1.37
- GRM
- 7.4
CMA / ARV
No comps found within radius.
Projected returns pro-forma
-3.0% appreciation · 5.86% rent growth · sell at horizon
- IRR
- -0.6%
- Equity multiple
- 0.98×
- Total profit
- $-1,412
- Equity at exit
- $32,788
- IRR
- 11.9%
- Equity multiple
- 2.06×
- Total profit
- $65,378
- Equity at exit
- $19,013
Cash invested: $61,572 (down + closing). Projections, not guarantees.
Landlord ↔ Tenant lean methodology
- Overall (STATE)
- 46 Balanced
- State Minnesota
- 46 Balanced · D+2
- County
- — inherits STATE
- City
- — inherits STATE
ZIP-level market 55311
- Rents YoY
- 5.9%
- Active inventory
- 300
- Price-to-rent
- 7.4×
Monthly cashflow live
- Estimated rent
- $2,472 high interval (Pro) →
- Mortgage (P&I)
- −$1,153
- Tax from tax record
- −$286 /mo · $3,436/yr
- Insurance
- −$92
- HOA
- −$0
- Vacancy / Maint / Mgmt
- −$519
- Net cashflow
- $422
Break-even live
UW: 25.0% down · 7.5% · 30yr · 1.5% tax · 5.0% vac · 8.0% maint · 8.0% mgmt
Financing live
Cash to close
- Down payment
- $54,975
- Closing costs
- $6,597
- Reserves months
- —
- Total cash needed
- —
Loan-product check · same deal, 3 products live
Conventional
25% down · 7.5% · 30yr
- Down + closing
- —
- Monthly P&I
- —
- Monthly cashflow
- —
- DSCR
- —
- Eligible?
- —
Personal DTI + credit; lowest rate.
DSCR
20% down · 8.5% · 30yr
- Down + closing
- —
- Monthly P&I
- —
- Monthly cashflow
- —
- DSCR
- —
- Eligible?
- —
No personal income docs; deal must DSCR.
Hard money
10% down · 12.0% · 12mo
- Down + closing
- —
- Monthly P&I
- —
- Monthly cashflow
- —
- DSCR
- —
- Eligible?
- —
Short-term bridge; refi at stabilization.
Rent comps 9 comps
| Address | Beds | Baths | Sqft | Rent | $/sqft | DOM | Units | Dist |
|---|---|---|---|---|---|---|---|---|
| 13465 60th Pl N #31 Minneapolis, MN | 2.0 | 1.0 | 1208 | $2,100 | $1.74 | 3d | 1 | 0.54mi |
| 6400 Sycamore Ln N Maple Grove, MN | 1.0–2.0 | 1.0–2.0 | 958 | $1,965 | $2.05 | 2d | 11 | 0.72mi |
| 5814 Teakwood Ln N Plymouth, MN | 2.0–3.0 | 1.0–2.0 | 1224 | $2,534 | $2.07 | 1d | 12 | 0.90mi |
| 6110 Quinwood Ln N Minneapolis, MN | 1.0–3.0 | 1.0–2.0 | 1047 | $2,495 | $2.38 | 1d | 22 | 0.95mi |
| 15377 60th Ave N Minneapolis, MN | 3.0 | 2.5 | 1792 | $2,400 | $1.34 | 16d | 1 | 1.07mi |
| 6876 Vicksburg Ln N Maple Grove, MN | 2.0–3.0 | 1.5 | 1110 | $2,350 | $2.12 | 1d | 6 | 1.28mi |
| 13874 52nd Ave N Minneapolis, MN | 2.0 | 1.5 | 1500 | $1,995 | $1.33 | 24d | 1 | 1.41mi |
| 13874 52nd Ave N Minneapolis, MN | 2.0 | 1.5 | 1500 | $1,995 | $1.33 | 4d | 1 | 1.41mi |
| 5200 Annapolis Ln N Minneapolis, MN | 2.0 | 1.0–2.0 | 953 | $2,330 | $2.44 | 2d | 13 | 1.44mi |
Listing history 2 events
-
2026-06-17remarks 681-char remark
-
2026-06-17$219,900 Coming Soon 1 DOM
ⓘ Source: listings_history table (triggers on properties + properties_extension) + one-shot
backfill from property_details.listing_events for pre-trigger history.
Tax reassessment forecast MN · Partial reset (capped growth)
- Current annual tax
- $3,436 · $286/mo
- Projected year-2 tax
- $3,436 · $286/mo
- Expected delta
- $0/yr ($0/mo · 0.0%)
ⓘ Screening estimate from a state-policy table — verify with the county assessor before closing.
Climate risk First Street
- Flood 1/10 Low FEMA zone X (unshaded) · 0% chance over 30 yrs
- Wildfire 1/10 Low
- Heat 2/10 Low 7 d/yr ≥99°F today · 13 d/yr by 30 yrs out
- Wind 2/10 Low
- Air quality 2/10 Low 1 unhealthy d/yr today · 1 by 30 yrs out
Nearby sold comps map
Loading sold comps map…
Walkable amenities ~0.75 mi
Loading nearby amenities…
Taxation est. · year 1
- Rental income
- $29,664
- − Mortgage interest
- −$12,318
- − Property taxes
- −$3,436
- − Insurance
- −$1,100
- − Repairs & maintenance
- −$2,373
- − Management
- −$2,373
- − Depreciation
- −$6,397
- Taxable income
- $1,667
- Est. tax owed @ 24.0%
- −$400
- After-tax cash flow
- $4,661/yr
For passive investors: Depreciation is non-cash, so a rental often shows a tax loss while cash-flowing — sheltering income. Rental losses are passive: they offset passive income freely, and up to $25,000/yr can offset ordinary (W-2) income if you actively participate and your MAGI is under $100k (phasing out to $0 by $150k); unused losses carry forward. On sale, claimed depreciation is recaptured at up to 25%, and gains may owe capital-gains tax (a 1031 exchange can defer both). Figures are a year-1 estimate at your 24.0% rate — not tax advice; consult a CPA.
Schools (NCES district)
- District
- Osseo Public School District
- NCES district ID
- 2725200
- Math proficiency
- 42% ▼ -7.00%
- Reading proficiency
- 51% ▼ -4.00%
- Median HH income
- $76,168
- Composite
- 42.35/100
- National rank
- #3250
- State rank
- #129 of 301 in MN
Livability — Maple Grove
- Score
- 81/100
- State rank
- #54
- US rank
- #1353
Category grades
Schools grade is shown separately in the Schools card above.
Census & demographics
- Census place
- Maple Grove, MN
- County
- Hennepin County · 1,150,272 people
- City population
- 77,762
- Metro
- Minneapolis-St. Paul-Bloomington, MN-WI
- Population (ZIP)
- 38,472
- Household income
- $153,568
- Rent vs Own
- Severe rent burden
- 497.0
Population outlook (Hennepin County) Hauer SSP2
- Today (2025)
- 1,405,227 people
- By 2030
- 1,492,650 · +6.2%
- By 2040
- 1,660,157 · +18.1%
- By 2050
- 1,823,498 · +29.8%
- By 2075
- 2,221,283 · +58.1%
- By 2100
- 2,509,976 · +78.6%
Race, ethnicity, and origin ACS 2023
- Neighborhood character
- Predominantly White (80%)
- Race & ethnicity
- White 80% Asian 8% Black 7% Two or more races 3% Hispanic / Latino 1%
- Common ancestry
- Portuguese 12% Lithuanian 4% Romanian 4%
- Foreign-born
- 12% · Canada, Vietnam, South Korea
- Languages at home
- 87% English-only · Other Indo-European 3% Vietnamese 1% Chinese 1%
Political lean MEDSL · Hennepin
- 2024 margin
- Solid D (+42.6) · D 70.2% · R 27.5% · Other 2.3%
- 2008→2024 swing
- +14.0pp toward D · 2008: 28.6pp · 2024: 42.6pp
- All cycles
- 2024: D+42.6 2020: D+43.2 2016: D+35.3 2012: D+27.1 2008: D+28.6
Not yet ingested
- Civics
- —
Market trends
- HPI YoY
- ▼ -181.69%
- Current HPI
- 213.3896
- Rent YoY
- ▲ 5.86%
- Metro
- Minneapolis-St. Paul-Bloomington, MN-WI
- State GDP YoY
- ▲ 2.41%
- F500 in state
- 34
Industry mix (Fortune 500 HQ in MN)
| Industry | F500 HQs | Revenue |
|---|---|---|
| Healthcare | 2 | $407B |
|
||
| Retail | 2 | $150B |
|
||
| Consumer Goods | 2 | $32B |
|
||
| Industrial Machinery | 2 | $6B |
|
||
| Agriculture | 1 | $40B |
|
||
| Healthcare / Medical Devices | 1 | $32B |
|
||
Price history
+144.6% since first listed9 events — show timeline
- 2026-06-17 Coming Soon $219,900 NORTHSTARMLS as Distributed by MLS Grid
- 1995-10-06 Sold (Public Records) $89,000 Public Records
- 1995-09-19 Sold (Public Records) $89,000 Public Records
- 1995-08-15 Listing Removed — NORTHSTARMLS as Distributed by MLS Grid
- 1995-08-14 Sold (MLS) $89,000 NORTHSTARMLS as Distributed by MLS Grid
- 1995-07-10 Listed $92,900 NORTHSTARMLS as Distributed by MLS Grid
- 1993-08-12 Sold (Public Records) $87,500 Public Records
- 1993-05-26 Sold (MLS) $87,500 NORTHSTARMLS as Distributed by MLS Grid
- 1993-04-20 Listed $89,899 NORTHSTARMLS as Distributed by MLS Grid
Property tax history
+2.5%/yrLatest (2025): $3,436 · -4.9% YoY. Source: county tax records.
Cash-flow waterfall
monthlySold comps — $/sqft
last 12 mo · ≤1 miLoading sold comps…