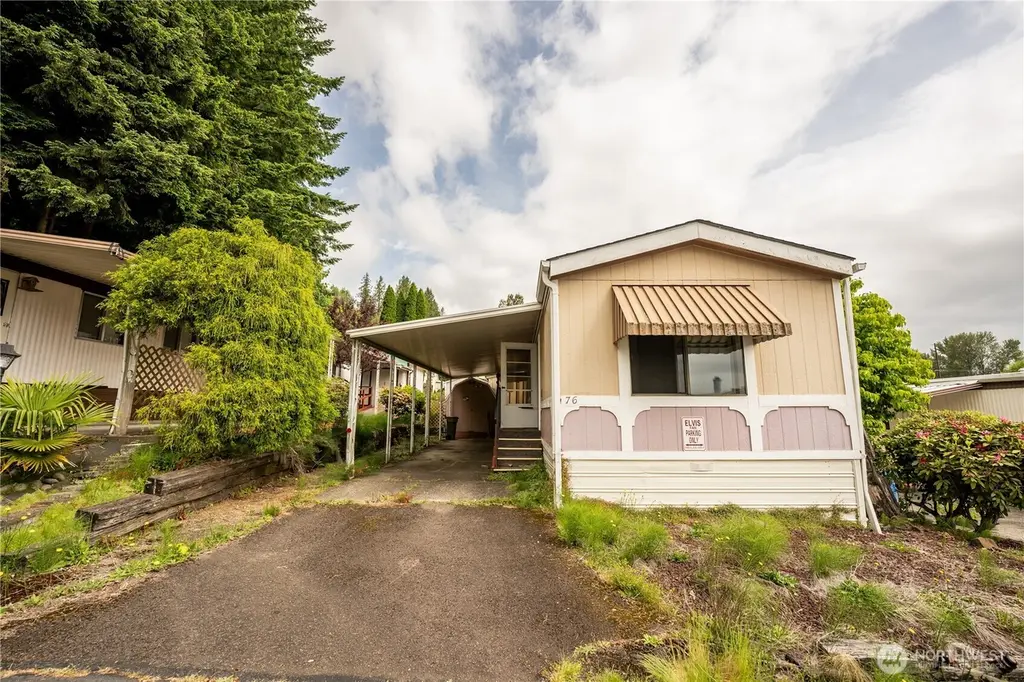
1965 West Side Hwy #76
Lexington, WA 98626
$39,000C-
2 bd · 2.0 ba ·
924 sqft ·
Built 1989
· Manufactured
· Active
· 18 DOM
Cashflow @ list (25.0% down · 7.5%)
Estimated rent
$1,891/mo
Mortgage (P&I)
−$205
Tax + insurance
−$90
HOA
−$0
Vac / Maint / Mgmt
−$397
Net cashflow
$1,199/mo
Annual
$14,392/yr
Cap rate
43.20%
Cash-on-cash
131.79%
DSCR
6.86
1% rule
4.85%
Cash to close
$10,920
Investor read
- This is a 2-bed/2.0-bath manufactured listed at $39k.
- At list price, monthly cash flow is $1k ($14k/yr) — positive.
- The deal already cash-flows at list — no discount required.
- Meets the 1% rule at list price ($2k rent vs $39k).
- It's been on market 18 days — a 2% lower offer ($38k) is reasonable based on typical stale-listing flexibility.
- Recommended offer: $38k (1.5% below list) — sets the bar for market timing.
- Local home prices are declining (-3.0%/yr); year-one equity from $270 of loan paydown is wiped out by about $1k of value loss. Plan a longer hold.
- Location reads: area grade C — affects rentability + tenant quality, not the cash-flow math above.
- Kelso School District (suburban): math 35% / reading 53% proficiency, ranked #191 of 291 in WA (top 66%) — families likely to look elsewhere, expect single-tenant / working-renter base with shorter leases.
- Zoned schools: Lexington Elementary (798 students, 69% FRL) — zoned schools average 69% FRL vs 50% district-wide (19 pts higher); higher-poverty schools than district average — tighter screening recommended.
- Market conditions: Rents rising fast (+4.1%/yr); 217 active listings in the ZIP; 2 comparable units currently listed for rent nearby; solid renter incomes; 348 units permitted in Cowlitz County in 2024 (40 in 5+ unit buildings).
- Cowlitz County population projected to shrink 8% by 2050 — rents likely to lag national; underwrite the cash flow, not the appreciation.
- 2 sale attempts since 3y ago with the ask held roughly flat each time — persistent listings suggest the price (not the market) is what's stuck; bring a comps-based counter.
- At projected returns (-3.0% appreciation + 4.1% rent growth), your $11k cash investment doubles in ~1 year — after that, you're playing with house money.
- Cap rate 43.2% vs local median 3.5% in Lexington — top-decile yield for the area; either an underpriced asset or a hidden risk that comps aren't pricing in. Stress-test before assuming the spread holds.
- This rent runs 30% of the median local income ($76k/yr) — at the standard rent-burdened threshold; future hikes will face affordability resistance.
Questions for listing agent
- Is there a deadline driving the sale (1031 exchange, divorce, estate, relocation)? That informs how much negotiation room exists.
- What's the average days-on-market for RENTAL listings here right now (not sales)? A rising rental-DOM trend means longer vacancies and softer asking-rent achievability than the comps imply.
- What's the recent tenant-quality profile in this submarket — average credit score on applications, eviction rate, late-payment / NSF rate, and stable-employment percentage? A property-management company in the area should have these aggregated.
- How much new for-sale + rental construction is in the pipeline within 1–3 miles? Heavy new supply typically softens prices + rents 12–24 months out; constrained supply supports both.
CashFlowRE · CFR-MH3GXYEX63MF9A
· Data 23 h ago
cashflowre.app · 2026-05-29