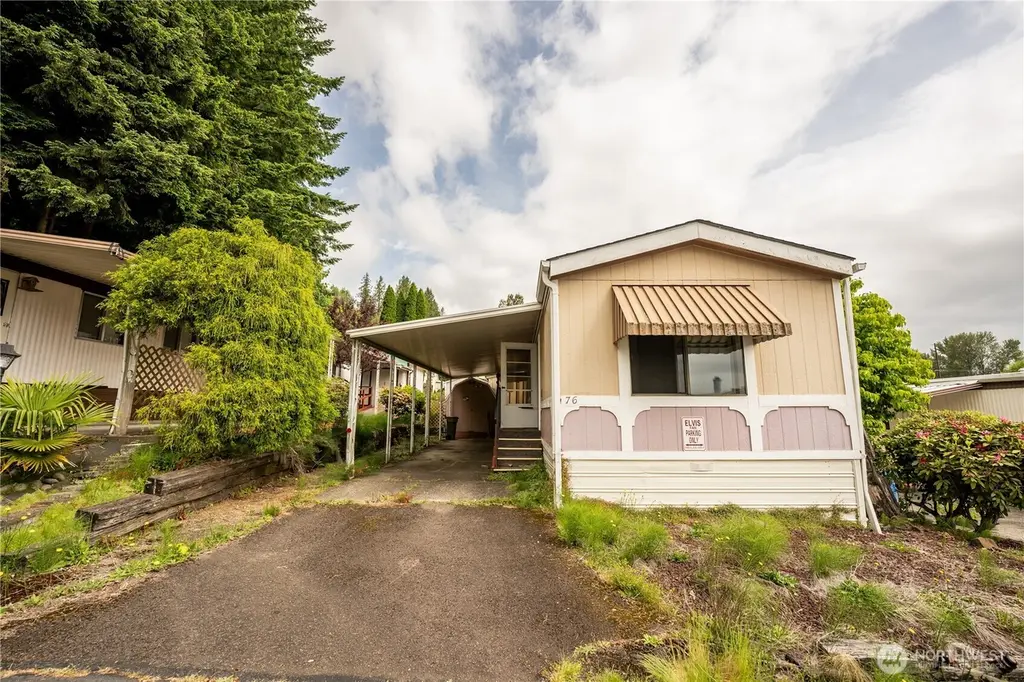
1965 West Side Hwy #76 · Lexington, WA
Flood risk 3/10 · Minor
- FEMA flood zone
- X
- Chance of flooding over 30 yrs
- 0.2%
- Est. flood insurance / yr
- $507 – $1,088
Fire risk 3/10 · Minor
- Est. fire insurance / yr
- $604 – $1,122
Heat risk 3/10 · Minor
- Hot days now (above 89°F)
- 8 days/yr
- Hot days in 30 yrs
- 16 days/yr
Wind risk 1/10 · Minimal
- Chance of severe wind over 30 yrs
- —
Air-quality risk 7/10 · Major
- Unhealthy air days now
- 8 days/yr
- Unhealthy air days in 30 yrs
- 8 days/yr
Risk factors via First Street. Map © Google.
Why this score? — see what drove the C- grade
The composite is a weighted blend of 9 inputs, each scored 0–100. Each bar is that input's sub-score; the figure is the points it added to the 100-point composite (weight × sub-score).
- Cash flow +15.0/30.0
- ARV discount +15.0/15.0
- 1% rule +5.0/10.0
- DSCR +5.0/10.0
- Schools +4.0/10.0
- Rent growth +3.5/5.0
- Livability +2.5/5.0
- Condition / age +2.5/5.0
- Appreciation +0.0/10.0
$39,000
🖨 Deal sheet 📄 Offer letter ✓ Due diligence
Listing remarks
Great opportunity to build in some sweat equity. This is in good condition just needs a little spruce up. This home is being sold AS IS. This is a 55 and older park. This home offers a large living space with an open concept with the living room, kitchen and eating area with a slider leading out to the sunroom you can enjoy all year long. Two nice sized bedrooms with the front bedroom having its own bath with walk-in shower. The full ball is located just down the hall. Outside you have a covered carport, covered deck and has storage plus a bonus room all on a lot that will require very little maintenance. Buyer to be park approved prior to an accepted offer.
Key facts
- Covered deck
- Storage
- Open concept
Tags
Property features AI
Finance
- Other: Calculated living area approximately 924 square feet; Lot is about 0.09 acre
- Financial info: Accepted financing: Cash, Conventional; Buyer brokerage compensation: $2,000
- HOA & community: Land lease: $801/month; Park approved for sale; Senior community; Approximately 118 homes in the park
Exterior
- Parking: Carport
- Utilities: Public water (Beacon Hill); Public sewer (Beacon Hill); Electric service (Cowlitz PUD)
- Home design: Manufactured single-wide home; One level; Manufactured after 6/15/1976; Manufacture make Marlette, model 100; Property in fair condition; Mobile home remains on site
- Construction: Metal/vinyl and wood construction; Concrete ribbon foundation; Shingled roof not specified
- Exterior features: Metal/vinyl and wood exterior; Awnings; Wood products; Skirted with metal; Located on a paved dead-end street; Park amenities include clubhouse and common area
Interior
- Kitchen: Dishwasher; Refrigerator; Stove/Range
- Bedrooms: 2 bedrooms
- Flooring: Laminate flooring; Vinyl flooring
- Bathrooms: 1 full bath; 1 three-quarter bath; Includes 1 bathtub and 1 shower
- Heating & cooling: Forced air heating; Electric energy source
- Interior features: Ceiling fans; Double-pane windows; Skylights; Patio/porch/deck; Bath off primary; Extra finished room; Kitchen with eating space; Living room
Neighborhood map
What this means for you Summary
Snapshot
- This is a 2-bed/2.0-bath manufactured listed at $39k.
Deal economics
- At list price, monthly cash flow is $1k ($14k/yr) — positive.
- The deal already cash-flows at list — no discount required.
- Meets the 1% rule at list price ($2k rent vs $39k).
- Recommended offer: $38k (1.5% below list) — sets the bar for market timing.
- Cap rate 43.2% vs local median 3.5% in Lexington — top-decile yield for the area; either an underpriced asset or a hidden risk that comps aren't pricing in. Stress-test before assuming the spread holds.
Location & tenants
- Location reads: area grade C — affects rentability + tenant quality, not the cash-flow math above.
- Kelso School District (suburban): math 35% / reading 53% proficiency, ranked #191 of 291 in WA (top 66%) — families likely to look elsewhere, expect single-tenant / working-renter base with shorter leases.
- Zoned schools: Lexington Elementary (798 students, 69% FRL) — zoned schools average 69% FRL vs 50% district-wide (19 pts higher); higher-poverty schools than district average — tighter screening recommended.
- Market conditions: Rents rising fast (+4.1%/yr); 217 active listings in the ZIP; 2 comparable units currently listed for rent nearby; solid renter incomes; 348 units permitted in Cowlitz County in 2024 (40 in 5+ unit buildings).
- This rent runs 30% of the median local income ($76k/yr) — at the standard rent-burdened threshold; future hikes will face affordability resistance.
Forward outlook
- Local home prices are declining (-3.0%/yr); year-one equity from $270 of loan paydown is wiped out by about $1k of value loss. Plan a longer hold.
- Cowlitz County population projected to shrink 8% by 2050 — rents likely to lag national; underwrite the cash flow, not the appreciation.
- At projected returns (-3.0% appreciation + 4.1% rent growth), your $11k cash investment doubles in ~1 year — after that, you're playing with house money.
Negotiation context
- It's been on market 18 days — a 2% lower offer ($38k) is reasonable based on typical stale-listing flexibility.
- 2 sale attempts since 3y ago with the ask held roughly flat each time — persistent listings suggest the price (not the market) is what's stuck; bring a comps-based counter.
Questions for the listing agent
- Is there a deadline driving the sale (1031 exchange, divorce, estate, relocation)? That informs how much negotiation room exists.
- What's the average days-on-market for RENTAL listings here right now (not sales)? A rising rental-DOM trend means longer vacancies and softer asking-rent achievability than the comps imply.
- What's the recent tenant-quality profile in this submarket — average credit score on applications, eviction rate, late-payment / NSF rate, and stable-employment percentage? A property-management company in the area should have these aggregated.
- How much new for-sale + rental construction is in the pipeline within 1–3 miles? Heavy new supply typically softens prices + rents 12–24 months out; constrained supply supports both.
Investment metrics
- 1% rule
- 4.85% ✓
- Cap rate
- 43.20%
- Cash-on-cash
- 131.79%
- DSCR
- 6.86
- GRM
- 1.7
CMA / ARV
- ARV (on-the-fly)
- $66,528
- Comps found
- 2
Show comp detail 2 sales within ~0.75 mi
| Address | Dist | Beds/Ba | Sqft | Sold | Price | $/sf | Match |
|---|---|---|---|---|---|---|---|
| 1965 West Side Hwy #46 | 0.04mi | 2/2.0 | 924 (0%) | 10mo | $55,000 | $60 | 90 |
| 1965 West Side Hwy #48 | 0.05mi | 3/2.0 (+1) | 1,008 (+9%) | 9mo | $72,500 | $72 | 70 |
Match score weights: distance 35% · size 25% · config 20% · recency 20%. Top-matched comps best support the ARV.
Projected returns pro-forma
-3.0% appreciation · 4.1% rent growth · sell at horizon
- IRR
- —
- Equity multiple
- 7.61×
- Total profit
- $72,225
- Equity at exit
- $5,815
- IRR
- —
- Equity multiple
- 16.60×
- Total profit
- $170,308
- Equity at exit
- $3,372
Cash invested: $10,920 (down + closing). Projections, not guarantees.
Landlord ↔ Tenant lean methodology
- Overall (STATE)
- 28 Tenant-Leaning
- State Washington
- 28 Tenant-Leaning · D+8
- County
- — inherits STATE
- City
- — inherits STATE
ZIP-level market 98626
- Rents YoY
- 4.1%
- Active inventory
- 217
- Price-to-rent
- 1.7×
Monthly cashflow live
- Estimated rent
- $1,891 medium interval (Pro) →
- Mortgage (P&I)
- −$205
- Tax from tax record
- −$74 /mo · $885/yr
- Insurance
- −$16
- HOA
- −$0
- Vacancy / Maint / Mgmt
- −$397
- Net cashflow
- $1,199
Break-even live
UW: 25.0% down · 7.5% · 30yr · 1.5% tax · 5.0% vac · 8.0% maint · 8.0% mgmt
Financing live
Cash to close
- Down payment
- $9,750
- Closing costs
- $1,170
- Reserves months
- —
- Total cash needed
- —
Loan-product check · same deal, 3 products live
Conventional
25% down · 7.5% · 30yr
- Down + closing
- —
- Monthly P&I
- —
- Monthly cashflow
- —
- DSCR
- —
- Eligible?
- —
Personal DTI + credit; lowest rate.
DSCR
20% down · 8.5% · 30yr
- Down + closing
- —
- Monthly P&I
- —
- Monthly cashflow
- —
- DSCR
- —
- Eligible?
- —
No personal income docs; deal must DSCR.
Hard money
10% down · 12.0% · 12mo
- Down + closing
- —
- Monthly P&I
- —
- Monthly cashflow
- —
- DSCR
- —
- Eligible?
- —
Short-term bridge; refi at stabilization.
Rent comps 2 comps
| Address | Beds | Baths | Sqft | Rent | $/sqft | DOM | Units | Dist |
|---|---|---|---|---|---|---|---|---|
| 118 Chickadee Dr Kelso, WA | 3.0 | 2.0 | 1076 | $2,400 | $2.23 | 43d | 1 | 1.36mi |
| 104 Solomon Rd Kelso, WA | 1.0–2.0 | 1.0–2.0 | 893 | $1,950 | $2.18 | 43d | 7 | 1.47mi |
Listing history 14 events
-
2026-06-19days on market $39,000 Active 18 DOM
-
2026-06-18days on market $39,000 Active 17 DOM
-
2026-06-17days on market $39,000 Active 16 DOM
-
2026-06-16days on market $39,000 Active 15 DOM
-
2026-06-15days on market $39,000 Active 14 DOM
-
2026-06-14days on market $39,000 Active 12 DOM
-
2026-06-13days on market $39,000 Active 11 DOM
-
2026-06-10days on market $39,000 Active 9 DOM
-
2026-06-09days on market $39,000 Active 8 DOM
-
2026-06-08days on market $39,000 Active 7 DOM
-
2026-06-07days on market $39,000 Active 6 DOM
-
2026-06-03days on market $39,000 Active 2 DOM
-
2026-06-02remarks 668-char remark
-
2026-06-02$39,000 Active 1 DOM
ⓘ Source: listings_history table (triggers on properties + properties_extension) + one-shot
backfill from property_details.listing_events for pre-trigger history.
Tax reassessment forecast WA · Resets to sale price
- Current annual tax
- $885 · $74/mo
- Projected year-2 tax
- $885 · $74/mo
- Expected delta
- $0/yr ($0/mo · 0.0%)
ⓘ Screening estimate from a state-policy table — verify with the county assessor before closing.
Climate risk First Street
- Flood 3/10 Moderate FEMA zone X · 20% chance over 30 yrs
- Wildfire 3/10 Moderate
- Heat 3/10 Moderate 8 d/yr ≥89°F today · 16 d/yr by 30 yrs out
- Wind 1/10 Low
- Air quality 7/10 Severe 8 unhealthy d/yr today · 8 by 30 yrs out
Nearby sold comps map
Loading sold comps map…
Walkable amenities ~0.75 mi
Loading nearby amenities…
Taxation est. · year 1
- Rental income
- $22,691
- − Mortgage interest
- −$2,185
- − Property taxes
- −$885
- − Insurance
- −$195
- − Repairs & maintenance
- −$1,815
- − Management
- −$1,815
- − Depreciation
- −$1,135
- Taxable income
- $14,662
- Est. tax owed @ 24.0%
- −$3,519
- After-tax cash flow
- $10,873/yr
For passive investors: Depreciation is non-cash, so a rental often shows a tax loss while cash-flowing — sheltering income. Rental losses are passive: they offset passive income freely, and up to $25,000/yr can offset ordinary (W-2) income if you actively participate and your MAGI is under $100k (phasing out to $0 by $150k); unused losses carry forward. On sale, claimed depreciation is recaptured at up to 25%, and gains may owe capital-gains tax (a 1031 exchange can defer both). Figures are a year-1 estimate at your 24.0% rate — not tax advice; consult a CPA.
Schools (NCES district)
- District
- Kelso School District
- NCES district ID
- 5300003
- Math proficiency
- 35% ▼ -2.00%
- Reading proficiency
- 53% ▼ -1.00%
- Median HH income
- $47,840
- Composite
- 39.83/100
- National rank
- #7963
- State rank
- #191 of 291 in WA
Livability — Lexington
No livability data for this city. (Only ~50 U.S. cities are tracked.)
Census & demographics
- Census place
- Lexington, WA
- County
- Cowlitz County · 77,527 people
- Metro
- Longview, WA
- Population (ZIP)
- 26,892
- Household income
- $75,528
- Rent vs Own
- Severe rent burden
- 722.0
Population outlook (Cowlitz County) Hauer SSP2
- Today (2025)
- 104,780 people
- By 2030
- 103,980 · -0.8%
- By 2040
- 100,769 · -3.8%
- By 2050
- 96,685 · -7.7%
- By 2075
- 86,454 · -17.5%
- By 2100
- 74,052 · -29.3%
Race, ethnicity, and origin ACS 2023
- Neighborhood character
- Predominantly White (85%)
- Race & ethnicity
- White 85% Hispanic / Latino 7% Two or more races 7% Native American 2% Asian 1%
- Hispanic origin (detail)
- Mexican 5%
- Common ancestry
- Portuguese 5% Slovak 4% Italian 3%
- Foreign-born
- 3% · Canada
- Languages at home
- 95% English-only · Spanish 3% Tagalog/Filipino 1%
Political lean MEDSL · Cowlitz
- 2024 margin
- R (+19.9) · D 38.7% · R 58.6% · Other 2.7%
- 2008→2024 swing
- -31.1pp toward R · 2008: 11.2pp · 2024: -19.9pp
- All cycles
- 2024: R+19.9 2020: R+17.4 2016: R+13.7 2012: D+4.4 2008: D+11.2
Not yet ingested
- Civics
- —
Market trends
- HPI YoY
- ▼ -321.36%
- Current HPI
- 262.8196
- Rent YoY
- ▲ 4.10%
- Metro
- Longview, WA
- State GDP YoY
- ▲ 4.65%
- F500 in state
- 22
Industry mix (Fortune 500 HQ in WA)
| Industry | F500 HQs | Revenue |
|---|---|---|
| Retail | 2 | $269B |
|
||
| Technology / Retail | 1 | $638B |
|
||
| Technology | 1 | $245B |
|
||
| Telecommunications | 1 | $38B |
|
||
| Food / Beverage | 1 | $36B |
|
||
| Automotive / Trucks | 1 | $34B |
|
||
Price history
-45.8% since first listed6 events — show timeline
- 2026-06-01 Listed $39,000 NWMLS as Distributed by MLS Grid
- 2023-09-25 Sold (MLS) $55,000 NWMLS as Distributed by MLS Grid
- 2023-09-06 Pending — NWMLS as Distributed by MLS Grid
- 2023-08-22 Price Changed $58,000 NWMLS as Distributed by MLS Grid
- 2023-08-15 Price Changed $70,000 NWMLS as Distributed by MLS Grid
- 2023-08-01 Listed $72,000 NWMLS as Distributed by MLS Grid
Property tax history
+13.0%/yrLatest (2026): $885 · -10.2% YoY. Source: county tax records.
Cash-flow waterfall
monthlySold comps — $/sqft
last 12 mo · ≤1 miLoading sold comps…