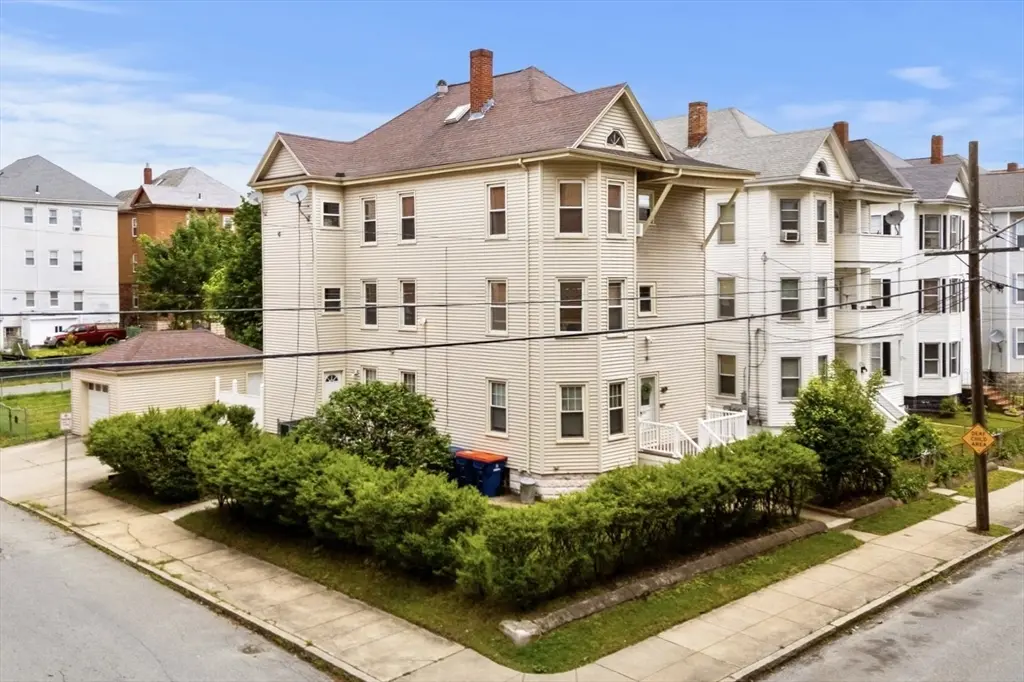
203 Deane St
New Bedford, MA 02746
$719,900D-
8 bd · 3.0 ba ·
3,321 sqft ·
Built 1908
· MultiFamily
· Active
· 10 DOM
Cashflow @ list (25.0% down · 7.5%)
Estimated rent
$6,153/mo
Mortgage (P&I)
−$3,775
Tax + insurance
−$746
HOA
−$0
Vac / Maint / Mgmt
−$1,292
Net cashflow
$340/mo
Annual
$4,081/yr
Cap rate
6.86%
Cash-on-cash
2.02%
DSCR
1.09
1% rule
0.85%
Cash to close
$201,572
Investor read
- This is a 3 × 3-bed/1.0-bath units multifamily listed at $720k.
- At list price, monthly cash flow is $340 ($4k/yr) — positive. Per door: $113/mo.
- The deal already cash-flows at list — no discount required.
- To meet the 1% rule (rent ≥ 1% of price), the offer needs to be $615k (14.5% below list).
- Only 10 days on market — expect competitive offers; lowballing is unlikely to land.
- Recommended offer: $615k (14.5% below list) — sets the bar for 1% rule.
- Local home prices are declining (-3.0%/yr); year-one equity from $5k of loan paydown is wiped out by about $22k of value loss. Plan a longer hold.
- Location reads 67/100 on livability (#155 in MA) — a middle-class / working-renter tenant base. Strengths: health & safety A+, housing B+; Watch: cost of living C-, schools D, employment D.
- New Bedford (suburban): math 17% / reading 28% proficiency, ranked #287 of 302 in MA (top 95%) — low school quality limits family demand, transient renter base, plan for 1-2y turnover; 65% free/reduced lunch — lower-income household profile, screen leases tightly.
- Watch-outs: built in 1908 — expect roof / HVAC / electrical / plumbing capex.
- Market conditions: 10 active listings in the ZIP; lower-income renter base — watch delinquency; 760 units permitted in Bristol County in 2024 (142 in 5+ unit buildings).
- Bristol County population projected to shrink 3% by 2050 — rents likely to lag national; underwrite the cash flow, not the appreciation.
- 2 sale attempts since 3y ago with the ask held roughly flat each time — persistent listings suggest the price (not the market) is what's stuck; bring a comps-based counter.
- Current owner paid $540k; 33% above their basis — modest negotiation headroom, anchor on the comps not their cost.
- Climate carrying-cost: severe wind risk, 80% chance of damaging wind over 30y; extreme-heat days projected 7→15/yr by 2055 (HVAC capex compounding) — expect insurance premiums to compound above CPI over the hold.
- Cap rate 6.9% vs local median 3.8% in New Bedford — top-decile yield for the area; either an underpriced asset or a hidden risk that comps aren't pricing in. Stress-test before assuming the spread holds.
- At $6,153/mo this rent would consume 176% of the median local household income ($42k/yr) (locally 2314% of renters already pay >50% of income on rent) — very limited rent-growth headroom before tenants either downsize or default.
Questions for listing agent
- Can we see the unit-by-unit rent roll, current vacancy, and any below-market leases? What's the average tenancy length?
- What capital expenditures (roof, boiler, parking lot, exteriors) have been made in the last 5 years, and what's planned in the next 2?
- Built in 1908 — when were the roof, HVAC, electrical panel, plumbing, and water heater last replaced?
- Is there a deadline driving the sale (1031 exchange, divorce, estate, relocation)? That informs how much negotiation room exists.
- Schools are D-rated, which usually means shorter tenancies and higher turnover. Who's the typical renter profile here, and what's been the actual vacancy rate?
- The area grade is low — what's the realistic commute time and amenity access for the typical tenant pool here? Any planned neighborhood developments (good or bad) we should know about?
- What's the average days-on-market for RENTAL listings here right now (not sales)? A rising rental-DOM trend means longer vacancies and softer asking-rent achievability than the comps imply.
- What's the recent tenant-quality profile in this submarket — average credit score on applications, eviction rate, late-payment / NSF rate, and stable-employment percentage? A property-management company in the area should have these aggregated.
CashFlowRE · CFR-MJEN8M0CS84DJH
· Data 2 days ago
cashflowre.app · 2026-05-29