 Triplex
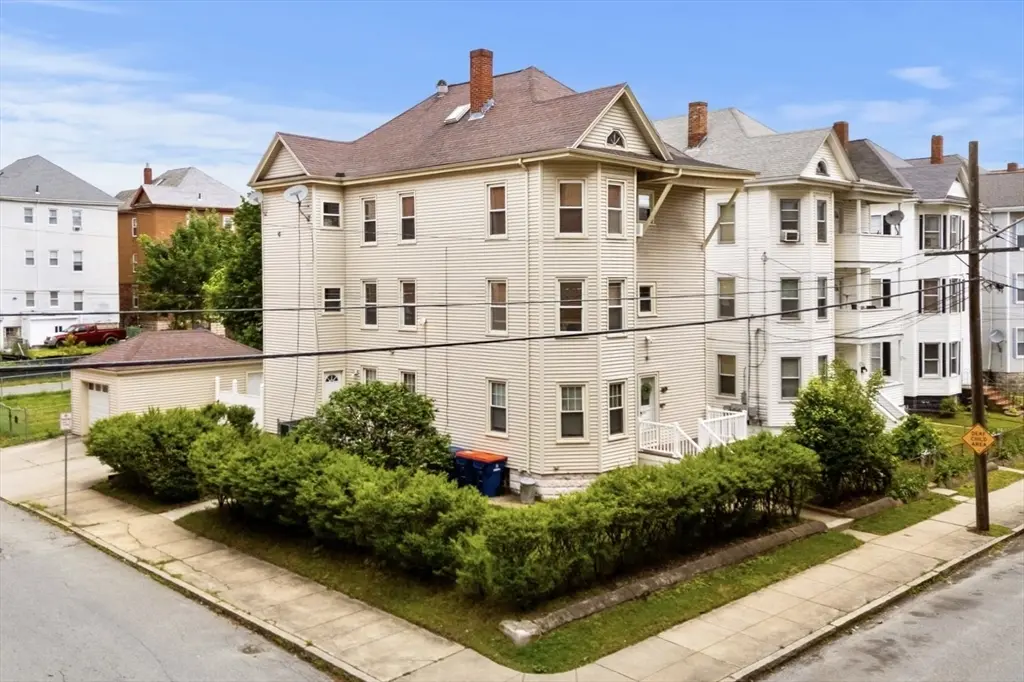
203 Deane St · New Bedford, MA
Flood risk 1/10 · Minimal
- FEMA flood zone
- X (unshaded)
- Chance of flooding over 30 yrs
- 0.0%
- Est. flood insurance / yr
- $473 – $860
Fire risk 2/10 · Minimal
- Est. fire insurance / yr
- $915 – $1,699
Heat risk 5/10 · Moderate
- Hot days now (above 96°F)
- 7 days/yr
- Hot days in 30 yrs
- 15 days/yr
Wind risk 8/10 · Major
- Chance of severe wind over 30 yrs
- 80.0%
Air-quality risk 2/10 · Minimal
- Unhealthy air days now
- 1 days/yr
- Unhealthy air days in 30 yrs
- 2 days/yr
Risk factors via First Street. Map © Google.
Why this score? — see what drove the D- grade
The composite is a weighted blend of 9 inputs, each scored 0–100. Each bar is that input's sub-score; the figure is the points it added to the 100-point composite (weight × sub-score).
- Cash flow +15.9/30.0
- DSCR +4.9/10.0
- ARV discount +4.0/15.0
- 1% rule +3.5/10.0
- Livability +3.4/5.0
- Rent growth +2.5/5.0
- Condition / age +2.5/5.0
- Schools +1.9/10.0
- Appreciation +0.0/10.0
$719,900
🖨 Deal sheet 📄 Offer letter ✓ Due diligence
Multi-family units
County records classify this as Multi-Family (2-4 Unit). Listing-text estimate: 3 units. confirmed
Listing remarks MLS
Beautiful maintained 3-Family home on a corner double lot with off street parking and a garage. Perfect for investment or owner occupied! This home features 2 beds on the 1st floor with an eat in kitchen, 3 bedrooms on the 2nd and 3rd floor. Baseboard heat on 1st floor. All 3 units have separate electric, gas and hot water. 1st floor and 2nd floor will be delivered vacant, 3rd floor tenant is at will. First showing at open house Saturday Jan 21 11:00-1:00 and Jan 22 11:00-1:00.
Key facts
- Minutes to t station
- Near shopping
- Full basement
Tags
Property features AI
Finance
- Other: Washer and dryer in Unit 1 are excluded from the sale
- HOA & community: Nearby public transportation, shopping, parks, laundromat, highway access, houses of worship, public schools, and T-Station
Exterior
- Parking: 1 garage space; 1 covered space; 2 open parking spaces; Total 3 parking spaces; Paved driveway and off-street parking
- Utilities: Public water; Public sewer; Electric with circuit breakers; Gas available for range
- Home design: 3-family property; 3 stories
- Construction: Frame construction; Block foundation; Shingle roof; Built (year per public records)
- Exterior features: Fenced yard; Porch; Patio; Rain gutters; Corner lot; Level lot; Paved road frontage (public)
Interior
- Kitchen: Range; Refrigerator
- Flooring: Tile; Carpet; Laminate; Hardwood
- Bathrooms: 3 full bathrooms
- Heating & cooling: Baseboard heating; Natural gas heating; Space heater
- Interior features: Walk-up attic; Ceiling fans; Living room; Dining room; Kitchen; 15 total rooms
- Laundry & utility: Washer hookup
Neighborhood map
What this means for you Summary
Snapshot
- This is a 3 × 3-bed/1.0-bath units multifamily listed at $720k.
Deal economics
- At list price, monthly cash flow is $340 ($4k/yr) — positive. Per door: $113/mo.
- The deal already cash-flows at list — no discount required.
- To meet the 1% rule (rent ≥ 1% of price), the offer needs to be $615k (14.5% below list).
- Recommended offer: $615k (14.5% below list) — sets the bar for 1% rule.
- Cap rate 6.9% vs local median 3.8% in New Bedford — top-decile yield for the area; either an underpriced asset or a hidden risk that comps aren't pricing in. Stress-test before assuming the spread holds.
Location & tenants
- Location reads 67/100 on livability (#155 in MA) — a middle-class / working-renter tenant base. Strengths: health & safety A+, housing B+; Watch: cost of living C-, schools D, employment D.
- New Bedford (suburban): math 17% / reading 28% proficiency, ranked #287 of 302 in MA (top 95%) — low school quality limits family demand, transient renter base, plan for 1-2y turnover; 65% free/reduced lunch — lower-income household profile, screen leases tightly.
- Market conditions: 10 active listings in the ZIP; lower-income renter base — watch delinquency; 760 units permitted in Bristol County in 2024 (142 in 5+ unit buildings).
- At $6,153/mo this rent would consume 176% of the median local household income ($42k/yr) (locally 2314% of renters already pay >50% of income on rent) — very limited rent-growth headroom before tenants either downsize or default.
Forward outlook
- Local home prices are declining (-3.0%/yr); year-one equity from $5k of loan paydown is wiped out by about $22k of value loss. Plan a longer hold.
- Bristol County population projected to shrink 3% by 2050 — rents likely to lag national; underwrite the cash flow, not the appreciation.
Negotiation context
- Only 10 days on market — expect competitive offers; lowballing is unlikely to land.
- 2 sale attempts since 3y ago with the ask held roughly flat each time — persistent listings suggest the price (not the market) is what's stuck; bring a comps-based counter.
- Current owner paid $540k; 33% above their basis — modest negotiation headroom, anchor on the comps not their cost.
Risks & watch-outs
- Watch-outs: built in 1908 — expect roof / HVAC / electrical / plumbing capex.
- Climate carrying-cost: severe wind risk, 80% chance of damaging wind over 30y; extreme-heat days projected 7→15/yr by 2055 (HVAC capex compounding) — expect insurance premiums to compound above CPI over the hold.
Questions for the listing agent
- Can we see the unit-by-unit rent roll, current vacancy, and any below-market leases? What's the average tenancy length?
- What capital expenditures (roof, boiler, parking lot, exteriors) have been made in the last 5 years, and what's planned in the next 2?
- Built in 1908 — when were the roof, HVAC, electrical panel, plumbing, and water heater last replaced?
- Is there a deadline driving the sale (1031 exchange, divorce, estate, relocation)? That informs how much negotiation room exists.
- Schools are D-rated, which usually means shorter tenancies and higher turnover. Who's the typical renter profile here, and what's been the actual vacancy rate?
- The area grade is low — what's the realistic commute time and amenity access for the typical tenant pool here? Any planned neighborhood developments (good or bad) we should know about?
- What's the average days-on-market for RENTAL listings here right now (not sales)? A rising rental-DOM trend means longer vacancies and softer asking-rent achievability than the comps imply.
- What's the recent tenant-quality profile in this submarket — average credit score on applications, eviction rate, late-payment / NSF rate, and stable-employment percentage? A property-management company in the area should have these aggregated.
- How much new apartment / multifamily construction is in the pipeline within 1–3 miles? Heavy new supply (>2% of stock underway) typically softens rents 12–24 months out; light construction supports rent growth.
Investment metrics
- 1% rule
- 0.85% ✗
- Cap rate
- 6.86%
- Cash-on-cash
- 2.02%
- DSCR
- 1.09
- GRM
- 9.7
CMA / ARV
- ARV (on-the-fly)
- $667,521
- Comps found
- 12
Show comp detail 12 sales within ~0.75 mi
| Address | Dist | Beds/Ba | Sqft | Sold | Price | $/sf | Match |
|---|---|---|---|---|---|---|---|
| 301 Davis St | 0.20mi | 9/4.0 (+1) | 3,321 (0%) | 7mo | $675,000 | $203 | 76 |
| 233 Belleville Rd | 0.52mi | 9/3.0 (+1) | 3,390 (+2%) | 0mo | $750,100 | $221 | 67 |
| 68 Hathaway St | 0.44mi | 9/3.0 (+1) | 3,231 (-3%) | 6mo | $690,000 | $214 | 64 |
| 100 Peckham St | 0.51mi | 9/3.0 (+1) | 3,390 (+2%) | 7mo | $660,000 | $195 | 62 |
| 498-500 Coggeshall St | 0.41mi | 7/3.0 (-1) | 3,530 (+6%) | 6mo | $710,000 | $201 | 61 |
| 108 Phillips Ave | 0.42mi | 7/3.0 (-1) | 3,045 (-8%) | 4mo | $635,000 | $209 | 59 |
| 57 Washburn St | 0.57mi | 9/3.0 (+1) | 3,450 (+4%) | 4mo | $650,000 | $188 | 58 |
| 234 Phillips Ave | 0.18mi | 9/3.0 (+1) | 3,774 (+14%) | 6mo | $695,000 | $184 | 58 |
| 121/123 Whitman | 0.56mi | 9/4.0 (+1) | 3,400 (+2%) | 6mo | $790,000 | $232 | 56 |
| 75 Nash Rd | 0.61mi | 9/3.0 (+1) | 3,594 (+8%) | 3mo | $660,000 | $184 | 50 |
| 121 Hope St | 0.72mi | 9/3.0 (+1) | 3,555 (+7%) | 5mo | $627,000 | $176 | 46 |
| 226 State St | 0.70mi | 9/3.0 (+1) | 3,567 (+7%) | 6mo | $650,000 | $182 | 45 |
Match score weights: distance 35% · size 25% · config 20% · recency 20%. Top-matched comps best support the ARV.
Projected returns pro-forma
-3.0% appreciation · 3.0% rent growth · sell at horizon
- IRR
- -13.1%
- Equity multiple
- 0.53×
- Total profit
- $-95,180
- Equity at exit
- $107,339
- IRR
- -4.2%
- Equity multiple
- 0.72×
- Total profit
- $-55,747
- Equity at exit
- $62,244
Cash invested: $201,572 (down + closing). Projections, not guarantees.
Landlord ↔ Tenant lean methodology
- Overall (STATE)
- 20 Strongly Tenant-Friendly
- State Massachusetts
- 20 Strongly Tenant-Friendly · D+15
- County
- — inherits STATE
- City
- — inherits STATE
ZIP-level market 02746
- Home prices YoY
- -4.6%
- Active inventory
- 10
- Price-to-rent
- 29.3×
Monthly cashflow live
- Estimated rent
- $6,153 high interval (Pro) →
- Mortgage (P&I)
- −$3,775
- Tax from tax record
- −$446 /mo · $5,347/yr
- Insurance
- −$300
- HOA
- −$0
- Vacancy / Maint / Mgmt
- −$1,292
- Net cashflow
- $340
Break-even live
3-unit breakdown (identical units grouped — click to expand)
| Units | Beds | Baths | Est. rent |
|---|---|---|---|
| 3× units | 3 | 1 | $6,153 |
| #1 | 3 | 1 | $2,051 |
| #2 | 3 | 1 | $2,051 |
| #3 | 3 | 1 | $2,051 |
| Total (3 units) | $6,153 | ||
UW: 25.0% down · 7.5% · 30yr · 1.5% tax · 5.0% vac · 8.0% maint · 8.0% mgmt
Financing live
Cash to close
- Down payment
- $179,975
- Closing costs
- $21,597
- Reserves months
- —
- Total cash needed
- —
Loan-product check · same deal, 3 products live
Conventional
25% down · 7.5% · 30yr
- Down + closing
- —
- Monthly P&I
- —
- Monthly cashflow
- —
- DSCR
- —
- Eligible?
- —
Personal DTI + credit; lowest rate.
DSCR
20% down · 8.5% · 30yr
- Down + closing
- —
- Monthly P&I
- —
- Monthly cashflow
- —
- DSCR
- —
- Eligible?
- —
No personal income docs; deal must DSCR.
Hard money
10% down · 12.0% · 12mo
- Down + closing
- —
- Monthly P&I
- —
- Monthly cashflow
- —
- DSCR
- —
- Eligible?
- —
Short-term bridge; refi at stabilization.
Listing history 7 events
-
2026-06-18days on market $719,900 Active 10 DOM
-
2026-06-17days on market $719,900 Active 9 DOM
-
2026-06-16days on market $719,900 Active 8 DOM
-
2026-06-15days on market $719,900 Active 7 DOM
-
2026-06-13statusdays on market $719,900 Active 5 DOM
-
2026-06-08remarks 699-char remark
-
2026-06-08$719,900 New 1 DOM
ⓘ Source: listings_history table (triggers on properties + properties_extension) + one-shot
backfill from property_details.listing_events for pre-trigger history.
Tax reassessment forecast MA · Partial reset (capped growth)
- Current annual tax
- $5,347 · $446/mo
- Projected year-2 tax
- $7,101 · $592/mo
- Expected delta
- +$1,754/yr (+$146/mo · 32.8%)
ⓘ Screening estimate from a state-policy table — verify with the county assessor before closing.
Climate risk First Street
- Flood 1/10 Low FEMA zone X (unshaded) · 0% chance over 30 yrs
- Wildfire 2/10 Low
- Heat 5/10 Major 7 d/yr ≥96°F today · 15 d/yr by 30 yrs out
- Wind 8/10 Severe 80% chance of damaging wind over 30 yrs
- Air quality 2/10 Low 1 unhealthy d/yr today · 2 by 30 yrs out
Nearby sold comps map
Loading sold comps map…
Walkable amenities ~0.75 mi
Loading nearby amenities…
Taxation est. · year 1
- Rental income
- $73,836
- − Mortgage interest
- −$40,326
- − Property taxes
- −$5,347
- − Insurance
- −$3,600
- − Repairs & maintenance
- −$5,907
- − Management
- −$5,907
- − Depreciation
- −$20,943
- Taxable loss
- −$8,192
- Est. tax savings @ 24.0%
- +$1,966
- After-tax cash flow
- $6,047/yr
For passive investors: Depreciation is non-cash, so a rental often shows a tax loss while cash-flowing — sheltering income. Rental losses are passive: they offset passive income freely, and up to $25,000/yr can offset ordinary (W-2) income if you actively participate and your MAGI is under $100k (phasing out to $0 by $150k); unused losses carry forward. On sale, claimed depreciation is recaptured at up to 25%, and gains may owe capital-gains tax (a 1031 exchange can defer both). Figures are a year-1 estimate at your 24.0% rate — not tax advice; consult a CPA.
Schools (NCES district)
- District
- New Bedford
- NCES district ID
- 2508430
- Math proficiency
- 17% ▼ -14.00%
- Reading proficiency
- 28% ▼ -6.00%
- Median HH income
- $37,901
- Composite
- 18.79/100
- National rank
- #8869
- State rank
- #287 of 302 in MA
Livability — New Bedford
- Score
- 67/100
- State rank
- #155
- US rank
- #10150
Category grades
Schools grade is shown separately in the Schools card above.
Census & demographics
- Census place
- New Bedford, MA
- County
- Bristol County · 342,083 people
- City population
- 76,528
- Metro
- Providence-Warwick, RI-MA
- Population (ZIP)
- 17,531
- Household income
- $41,917
- Rent vs Own
- Severe rent burden
- 2314.0
Population outlook (Bristol County) Hauer SSP2
- Today (2025)
- 570,212 people
- By 2030
- 571,181 · +0.2%
- By 2040
- 565,389 · -0.8%
- By 2050
- 552,141 · -3.2%
- By 2075
- 520,923 · -8.6%
- By 2100
- 474,363 · -16.8%
Race, ethnicity, and origin ACS 2023
- Neighborhood character
- Diverse neighborhood (Simpson 0.67)
- Race & ethnicity
- White 41% Hispanic / Latino 39% Two or more races 22% Black 6% Native American 1%
- Hispanic origin (detail)
- Mexican 2% Puerto Rican 14% Dominican 5%
- Common ancestry
- Russian 22% Lithuanian 3% Hispanic 2%
- Foreign-born
- 31% · Canada, Jamaica
- Languages at home
- 47% English-only · Spanish 29% Other Indo-European 18% French/Haitian/Cajun 4%
Political lean MEDSL · Bristol
- 2024 margin
- Toss-up / Even · D 49.8% · R 48.5% · Other 1.8%
- 2008→2024 swing
- -21.9pp toward R · 2008: 23.2pp · 2024: 1.3pp
- All cycles
- 2024: D+1.3 2020: D+12.0 2016: D+9.3 2012: D+20.5 2008: D+23.2
Not yet ingested
- Civics
- —
Market trends
- HPI YoY
- ▼ -20.92%
- Current HPI
- 432.5425
- Rent YoY
- —
- Metro
- Providence-Warwick, RI-MA
- State GDP YoY
- ▲ 2.28%
- F500 in state
- 38
Industry mix (Fortune 500 HQ in MA)
| Industry | F500 HQs | Revenue |
|---|---|---|
| Technology | 3 | $17B |
|
||
| Insurance | 2 | $84B |
|
||
| Retail | 2 | $76B |
|
||
| Life Sciences | 1 | $43B |
|
||
| Energy Technology | 1 | $31B |
|
||
| Aerospace / Defense | 1 | $18B |
|
||
Price history
+433.3% since first listed6 events — show timeline
- 2026-06-08 Listed $719,900 MLS PIN
- 2023-02-28 Sold (MLS) $540,000 MLS PIN
- 2023-01-25 Pending — MLS PIN
- 2023-01-16 Listed $499,900 MLS PIN
- 1998-11-24 Sold (Public Records) $114,900 Public Records
- 1989-02-10 Sold (Public Records) $135,000 Public Records
Property tax history
+3.4%/yrLatest (2023): $5,347 · +10.6% YoY. Source: county tax records.
Cash-flow waterfall
monthlySold comps — $/sqft
last 12 mo · ≤1 miLoading sold comps…