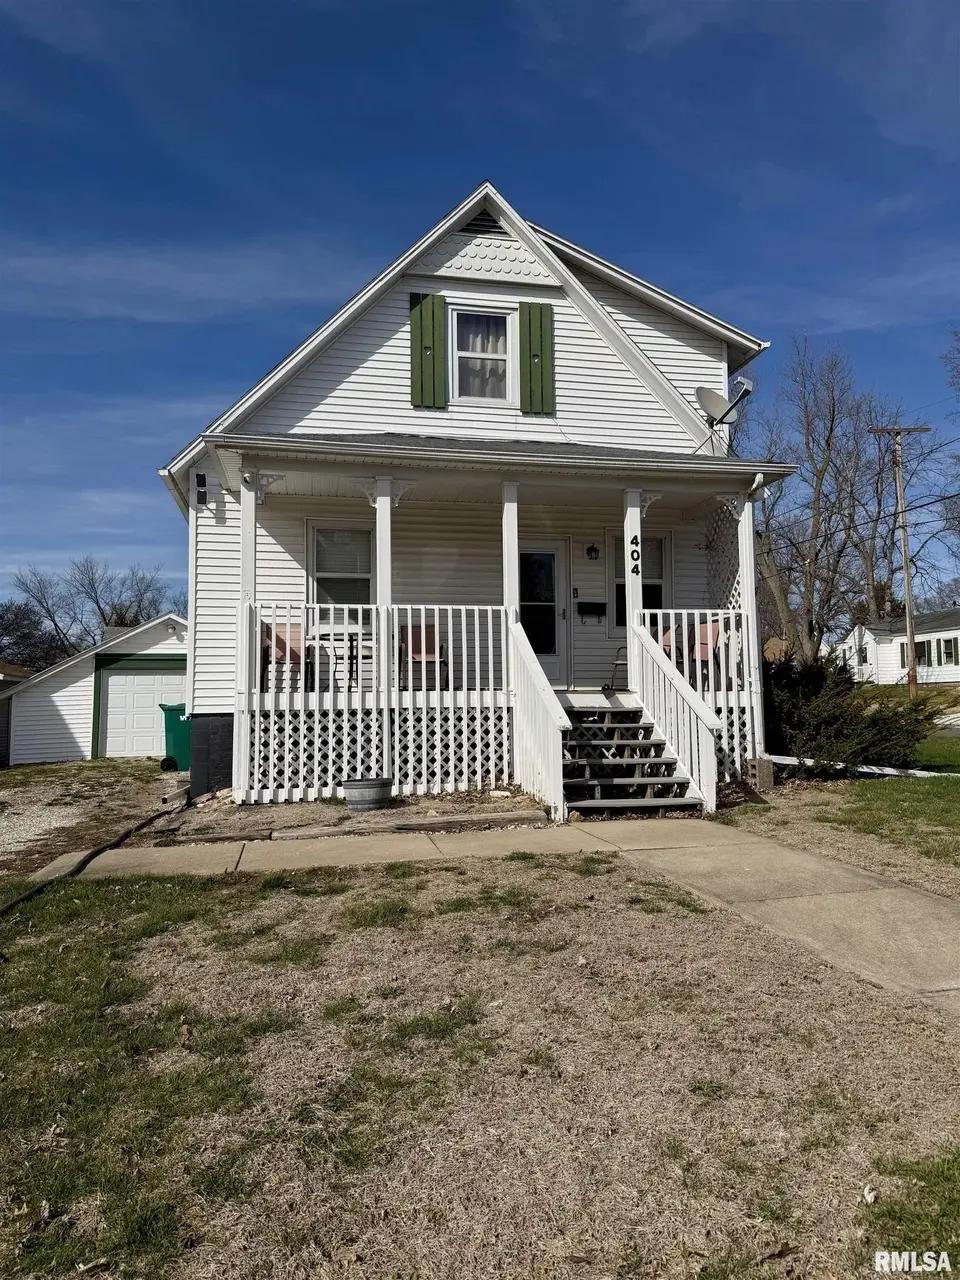
404 W Fisk St
Macomb, IL 61455
$75,000C-
3 bd · 1.0 ba ·
831 sqft ·
Built 1938
· SingleFamily
· Pending
· 5 DOM
Cashflow @ list (25.0% down · 7.5%)
Estimated rent
$905/mo
Mortgage (P&I)
−$393
Tax + insurance
−$149
HOA
−$0
Vac / Maint / Mgmt
−$190
Net cashflow
$172/mo
Annual
$2,067/yr
Cap rate
9.05%
Cash-on-cash
9.84%
DSCR
1.44
1% rule
1.21%
Cash to close
$21,000
Investor read
- This is a 3-bed/1.0-bath single-family listed at $75k.
- At list price, monthly cash flow is $172 ($2k/yr) — positive.
- The deal already cash-flows at list — no discount required.
- Meets the 1% rule at list price ($905 rent vs $75k).
- Only 5 days on market — expect competitive offers; lowballing is unlikely to land.
- Local home prices are declining (-3.0%/yr); year-one equity from $519 of loan paydown is wiped out by about $2k of value loss. Plan a longer hold.
- Location reads 70/100 on livability (#379 in IL) — a middle-class / working-renter tenant base. Strengths: cost of living A+, health & safety A+, housing B; Watch: crime D, amenities D, commute F.
- Macomb CUSD 185 (town): math 19% / reading 26% proficiency, ranked #410 of 620 in IL (top 66%) — low school quality limits family demand, transient renter base, plan for 1-2y turnover.
- Zoned schools: Macomb Junior High School (math 21% / reading 32%, grade F, #312 of 665 statewide, top 48%, 308 students, 0% FRL); Macomb Senior High School (math 27% / reading 37%, grade F, #157 of 693 statewide, top 25%, 622 students, 0% FRL) — zoned schools average 0% FRL vs 40% district-wide (40 pts lower); this property's tenant base skews higher-income than the district average.
- Watch-outs: built in 1938 — expect roof / HVAC / electrical / plumbing capex.
- Market conditions: 135 active listings in the ZIP; 1 comparable units currently listed for rent nearby.
- 2 sale attempts since 8y ago with the ask held roughly flat each time — persistent listings suggest the price (not the market) is what's stuck; bring a comps-based counter.
- Current owner paid $56k; 35% above their basis — modest negotiation headroom, anchor on the comps not their cost.
- Cap rate 9.0% vs local median 6.2% in Macomb — top-decile yield for the area; either an underpriced asset or a hidden risk that comps aren't pricing in. Stress-test before assuming the spread holds.
Questions for listing agent
- Built in 1938 — when were the roof, HVAC, electrical panel, plumbing, and water heater last replaced?
- Is there a deadline driving the sale (1031 exchange, divorce, estate, relocation)? That informs how much negotiation room exists.
- Schools are D-rated, which usually means shorter tenancies and higher turnover. Who's the typical renter profile here, and what's been the actual vacancy rate?
- Crime grade is D in this area — have there been break-ins, vandalism, or insurance claims at this property in the last 3 years? What carrier currently insures it and at what premium?
- What's the average days-on-market for RENTAL listings here right now (not sales)? A rising rental-DOM trend means longer vacancies and softer asking-rent achievability than the comps imply.
- What's the recent tenant-quality profile in this submarket — average credit score on applications, eviction rate, late-payment / NSF rate, and stable-employment percentage? A property-management company in the area should have these aggregated.
- How much new for-sale + rental construction is in the pipeline within 1–3 miles? Heavy new supply typically softens prices + rents 12–24 months out; constrained supply supports both.
CashFlowRE · CFR-MJP4CRE185MA0A
· Data 3 weeks ago
cashflowre.app · 2026-05-29