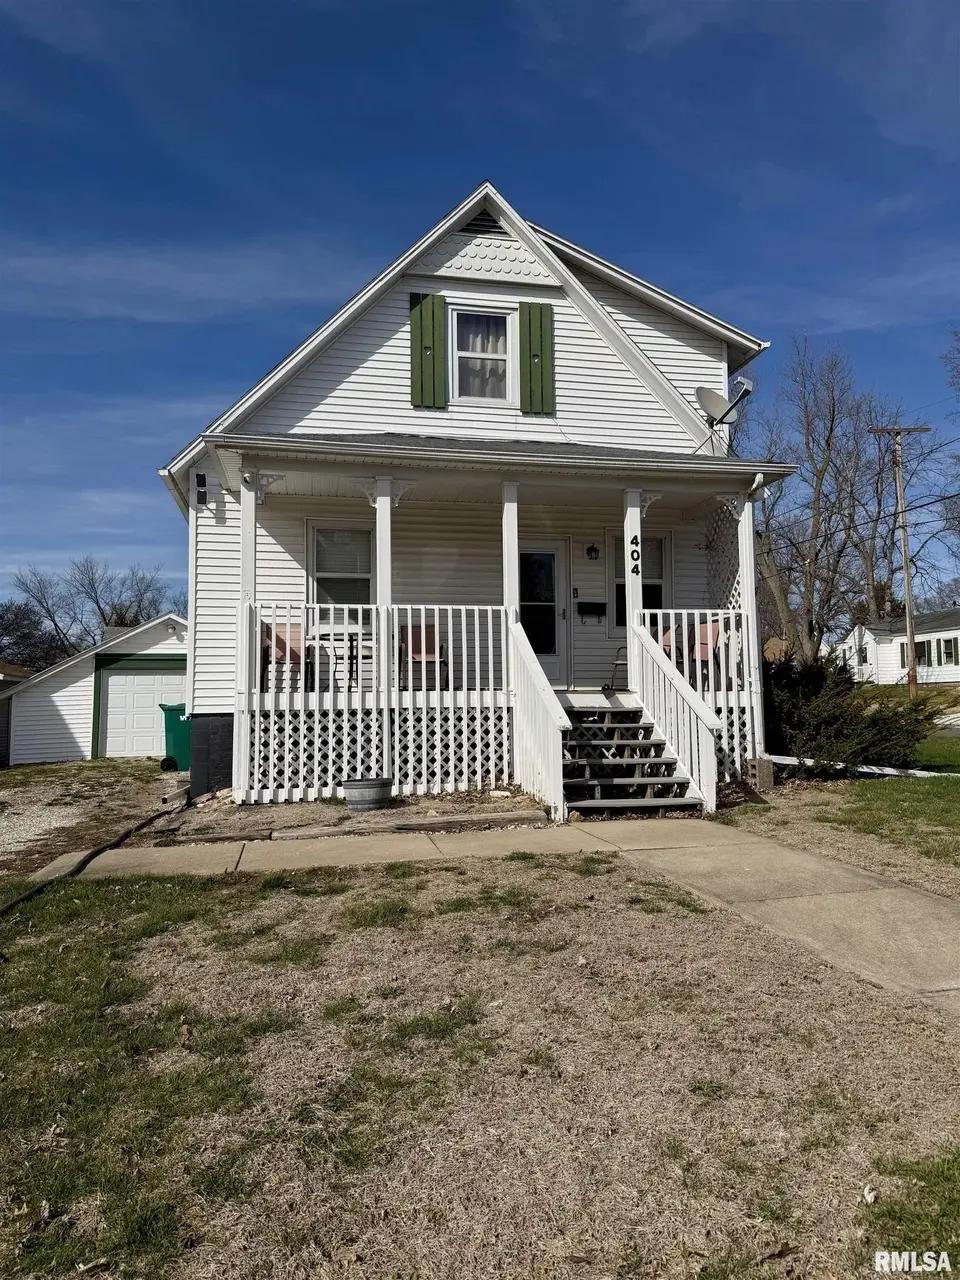
404 W Fisk St · Macomb, IL
Flood risk 1/10 · Minimal
- FEMA flood zone
- —
- Chance of flooding over 30 yrs
- 0.0%
- Est. flood insurance / yr
- —
Fire risk 1/10 · Minimal
- Est. fire insurance / yr
- $804 – $1,492
Heat risk 3/10 · Minor
- Hot days now (above 107°F)
- 7 days/yr
- Hot days in 30 yrs
- 17 days/yr
Wind risk 2/10 · Minimal
- Chance of severe wind over 30 yrs
- —
Air-quality risk 2/10 · Minimal
- Unhealthy air days now
- 1 days/yr
- Unhealthy air days in 30 yrs
- 1 days/yr
Risk factors via First Street. Map © Google.
Why this score? — see what drove the C- grade
The composite is a weighted blend of 9 inputs, each scored 0–100. Each bar is that input's sub-score; the figure is the points it added to the 100-point composite (weight × sub-score).
- Cash flow +25.4/30.0
- DSCR +8.4/10.0
- 1% rule +7.1/10.0
- Livability +3.5/5.0
- Rent growth +2.5/5.0
- Condition / age +2.5/5.0
- Schools +1.8/10.0
- ARV discount +0.0/15.0
- Appreciation +0.0/10.0
$75,000
🖨 Deal sheet 📄 Offer letter ✓ Due diligence
Listing remarks MLS
Impeccably clean and well-maintained 3-bedroom home with outstanding curb appeal. No deferred maintenance here! Recent updates include the home's siding, composite porch steps, sump pump, and toilet. Over the years, the owner also replaced the roof, added attic insulation, re-sided the garage, poured the patio and sidewalks, replaced 2 sides of the foundation walls with concrete block, re-graveled the driveway, and replaced the sewer line, furnace, and floor coverings. Video tour: Visit this link for a walkthrough of the entire home: https://youtu.be/mJ5GXFaEkKU
Key facts
- 0.24 acre lot
- Garage
- Built 1938
Neighborhood map
What this means for you Summary
Snapshot
- This is a 3-bed/1.0-bath single-family listed at $75k.
Deal economics
- At list price, monthly cash flow is $172 ($2k/yr) — positive.
- The deal already cash-flows at list — no discount required.
- Meets the 1% rule at list price ($905 rent vs $75k).
- Cap rate 9.0% vs local median 6.2% in Macomb — top-decile yield for the area; either an underpriced asset or a hidden risk that comps aren't pricing in. Stress-test before assuming the spread holds.
Location & tenants
- Location reads 70/100 on livability (#379 in IL) — a middle-class / working-renter tenant base. Strengths: cost of living A+, health & safety A+, housing B; Watch: crime D, amenities D, commute F.
- Macomb CUSD 185 (town): math 19% / reading 26% proficiency, ranked #410 of 620 in IL (top 66%) — low school quality limits family demand, transient renter base, plan for 1-2y turnover.
- Zoned schools: Macomb Junior High School (math 21% / reading 32%, grade F, #312 of 665 statewide, top 48%, 308 students, 0% FRL); Macomb Senior High School (math 27% / reading 37%, grade F, #157 of 693 statewide, top 25%, 622 students, 0% FRL) — zoned schools average 0% FRL vs 40% district-wide (40 pts lower); this property's tenant base skews higher-income than the district average.
- Market conditions: 135 active listings in the ZIP; 1 comparable units currently listed for rent nearby.
Forward outlook
- Local home prices are declining (-3.0%/yr); year-one equity from $519 of loan paydown is wiped out by about $2k of value loss. Plan a longer hold.
Negotiation context
- Only 5 days on market — expect competitive offers; lowballing is unlikely to land.
- 2 sale attempts since 8y ago with the ask held roughly flat each time — persistent listings suggest the price (not the market) is what's stuck; bring a comps-based counter.
- Current owner paid $56k; 35% above their basis — modest negotiation headroom, anchor on the comps not their cost.
Risks & watch-outs
- Watch-outs: built in 1938 — expect roof / HVAC / electrical / plumbing capex.
Questions for the listing agent
- Built in 1938 — when were the roof, HVAC, electrical panel, plumbing, and water heater last replaced?
- Is there a deadline driving the sale (1031 exchange, divorce, estate, relocation)? That informs how much negotiation room exists.
- Schools are D-rated, which usually means shorter tenancies and higher turnover. Who's the typical renter profile here, and what's been the actual vacancy rate?
- Crime grade is D in this area — have there been break-ins, vandalism, or insurance claims at this property in the last 3 years? What carrier currently insures it and at what premium?
- What's the average days-on-market for RENTAL listings here right now (not sales)? A rising rental-DOM trend means longer vacancies and softer asking-rent achievability than the comps imply.
- What's the recent tenant-quality profile in this submarket — average credit score on applications, eviction rate, late-payment / NSF rate, and stable-employment percentage? A property-management company in the area should have these aggregated.
- How much new for-sale + rental construction is in the pipeline within 1–3 miles? Heavy new supply typically softens prices + rents 12–24 months out; constrained supply supports both.
Investment metrics
- 1% rule
- 1.21% ✓
- Cap rate
- 9.05%
- Cash-on-cash
- 9.84%
- DSCR
- 1.44
- GRM
- 6.9
CMA / ARV
- ARV (on-the-fly)
- $56,508
- Comps found
- 12
Show comp detail 12 sales within ~0.75 mi
| Address | Dist | Beds/Ba | Sqft | Sold | Price | $/sf | Match |
|---|---|---|---|---|---|---|---|
| 510 W Kelly St | 0.12mi | 2/1.0 (-1) | 780 (-6%) | 6mo | $85,000 | $109 | 74 |
| 214 E Walker St | 0.44mi | 2/1.0 (-1) | 839 (+1%) | 1mo | $43,000 | $51 | 72 |
| 522 W Chase St | 0.19mi | 2/1.0 (-1) | 879 (+6%) | 12mo | $30,750 | $35 | 67 |
| 320 W Woodbury St | 0.24mi | 2/1.0 (-1) | 798 (-4%) | 14mo | $35,000 | $44 | 66 |
| 809 S Johnson St | 0.10mi | 2/2.0 (-1) | 772 (-7%) | 13mo | $67,000 | $87 | 64 |
| 520 W Jefferson St | 0.42mi | 2/1.0 (-1) | 839 (+1%) | 12mo | $50,000 | $60 | 63 |
| 731 S Johnson St | 0.10mi | 2/1.0 (-1) | 718 (-14%) | 11mo | $38,000 | $53 | 59 |
| 402 W Mcdonough St | 0.08mi | 2/1.0 (-1) | 920 (+11%) | 18mo | $62,500 | $68 | 59 |
| 310 S Madison St | 0.68mi | 2/1.0 (-1) | 820 (-1%) | 8mo | $21,000 | $26 | 55 |
| 525 W Washington St | 0.47mi | 2/1.0 (-1) | 786 (-5%) | 14mo | $59,000 | $75 | 52 |
| 601 Compton Pkwy | 0.68mi | 2/1.0 (-1) | 887 (+7%) | 11mo | $120,000 | $135 | 43 |
| 726 Bobby Ave | 0.75mi | 2/1.0 (-1) | 768 (-8%) | 9mo | $71,900 | $94 | 40 |
Match score weights: distance 35% · size 25% · config 20% · recency 20%. Top-matched comps best support the ARV.
Projected returns pro-forma
-3.0% appreciation · 3.0% rent growth · sell at horizon
- IRR
- -1.5%
- Equity multiple
- 0.94×
- Total profit
- $-1,156
- Equity at exit
- $11,183
- IRR
- 8.3%
- Equity multiple
- 1.63×
- Total profit
- $13,234
- Equity at exit
- $6,485
Cash invested: $21,000 (down + closing). Projections, not guarantees.
Landlord ↔ Tenant lean methodology
- Overall (STATE)
- 43 Moderately Tenant-Leaning
- State Illinois
- 43 Moderately Tenant-Leaning · D+7
- County
- — inherits STATE
- City
- — inherits STATE
ZIP-level market 61455
- Home prices YoY
- -33.3%
- Active inventory
- 135
- Price-to-rent
- 6.9×
Monthly cashflow live
- Estimated rent
- $905 medium interval (Pro) →
- Mortgage (P&I)
- −$393
- Tax from tax record
- −$118 /mo · $1,415/yr
- Insurance
- −$31
- HOA
- −$0
- Vacancy / Maint / Mgmt
- −$190
- Net cashflow
- $172
Break-even live
UW: 25.0% down · 7.5% · 30yr · 1.5% tax · 5.0% vac · 8.0% maint · 8.0% mgmt
Financing live
Cash to close
- Down payment
- $18,750
- Closing costs
- $2,250
- Reserves months
- —
- Total cash needed
- —
Loan-product check · same deal, 3 products live
Conventional
25% down · 7.5% · 30yr
- Down + closing
- —
- Monthly P&I
- —
- Monthly cashflow
- —
- DSCR
- —
- Eligible?
- —
Personal DTI + credit; lowest rate.
DSCR
20% down · 8.5% · 30yr
- Down + closing
- —
- Monthly P&I
- —
- Monthly cashflow
- —
- DSCR
- —
- Eligible?
- —
No personal income docs; deal must DSCR.
Hard money
10% down · 12.0% · 12mo
- Down + closing
- —
- Monthly P&I
- —
- Monthly cashflow
- —
- DSCR
- —
- Eligible?
- —
Short-term bridge; refi at stabilization.
Rent comps 1 comps
| Address | Beds | Baths | Sqft | Rent | $/sqft | DOM | Units | Dist |
|---|---|---|---|---|---|---|---|---|
| 902 N Charles St Macomb, IL | 2.0 | 1.5 | 840 | $695 | $0.83 | 43d | 1 | 1.22mi |
Listing history 5 events
-
2026-03-31status Pending
-
2026-03-26$75,000 Active
-
2019-08-02soldstatus $55,500
-
2019-07-29soldstatus $55,500 568-char remark
Show marketing remark (568 chars)
Impeccably clean and well-maintained 3-bedroom home with outstanding curb appeal. No deferred maintenance here! Recent updates include the home's siding, composite porch steps, sump pump, and toilet. Over the years, the owner also replaced the roof, added attic insulation, re-sided the garage, poured the patio and sidewalks, replaced 2 sides of the foundation walls with concrete block, re-graveled the driveway, and replaced the sewer line, furnace, and floor coverings. Video tour: Visit this link for a walkthrough of the entire home: https://youtu.be/mJ5GXFaEkKU
-
2018-10-15$59,900 568-char remark
Show marketing remark (568 chars)
Impeccably clean and well-maintained 3-bedroom home with outstanding curb appeal. No deferred maintenance here! Recent updates include the home's siding, composite porch steps, sump pump, and toilet. Over the years, the owner also replaced the roof, added attic insulation, re-sided the garage, poured the patio and sidewalks, replaced 2 sides of the foundation walls with concrete block, re-graveled the driveway, and replaced the sewer line, furnace, and floor coverings. Video tour: Visit this link for a walkthrough of the entire home: https://youtu.be/mJ5GXFaEkKU
ⓘ Source: listings_history table (triggers on properties + properties_extension) + one-shot
backfill from property_details.listing_events for pre-trigger history.
Tax reassessment forecast IL · Partial reset (capped growth)
- Current annual tax
- $1,415 · $118/mo
- Projected year-2 tax
- $1,559 · $130/mo
- Expected delta
- +$144/yr (+$12/mo · 10.2%)
ⓘ Screening estimate from a state-policy table — verify with the county assessor before closing.
Climate risk First Street
- Flood 1/10 Low 0% chance over 30 yrs
- Wildfire 1/10 Low
- Heat 3/10 Moderate 7 d/yr ≥107°F today · 17 d/yr by 30 yrs out
- Wind 2/10 Low
- Air quality 2/10 Low 1 unhealthy d/yr today · 1 by 30 yrs out
Nearby sold comps map
Loading sold comps map…
Walkable amenities ~0.75 mi
Loading nearby amenities…
Taxation est. · year 1
- Rental income
- $10,856
- − Mortgage interest
- −$4,201
- − Property taxes
- −$1,415
- − Insurance
- −$375
- − Repairs & maintenance
- −$868
- − Management
- −$868
- − Depreciation
- −$2,182
- Taxable income
- $946
- Est. tax owed @ 24.0%
- −$227
- After-tax cash flow
- $1,840/yr
For passive investors: Depreciation is non-cash, so a rental often shows a tax loss while cash-flowing — sheltering income. Rental losses are passive: they offset passive income freely, and up to $25,000/yr can offset ordinary (W-2) income if you actively participate and your MAGI is under $100k (phasing out to $0 by $150k); unused losses carry forward. On sale, claimed depreciation is recaptured at up to 25%, and gains may owe capital-gains tax (a 1031 exchange can defer both). Figures are a year-1 estimate at your 24.0% rate — not tax advice; consult a CPA.
Schools (NCES district)
- District
- Macomb CUSD 185
- NCES district ID
- 1723920
- Math proficiency
- 19% ▼ -7.00%
- Reading proficiency
- 26% ▼ -8.00%
- Median HH income
- $34,162
- Composite
- 18.45/100
- National rank
- #8927
- State rank
- #410 of 620 in IL
Livability — Macomb
- Score
- 70/100
- State rank
- #379
- US rank
- #7918
Category grades
Schools grade is shown separately in the Schools card above.
Census & demographics
- Census place
- Macomb, IL
- County
- McDonough County · 17,317 people
- City population
- 17,317
- Metro
- Macomb, IL
- Population (ZIP)
- 17,317
- Household income
- $48,679
- Rent vs Own
- Severe rent burden
- 1062.0
Population outlook (McDonough County) Hauer SSP2
- Today (2025)
- 33,242 people
- By 2030
- 33,318 · +0.2%
- By 2040
- 33,520 · +0.8%
- By 2050
- 33,630 · +1.2%
- By 2075
- 33,657 · +1.2%
- By 2100
- 33,127 · -0.3%
Race, ethnicity, and origin ACS 2023
- Neighborhood character
- Predominantly White (81%)
- Race & ethnicity
- White 81% Black 9% Two or more races 5% Hispanic / Latino 5% Asian 3%
- Common ancestry
- Romanian 3% Italian 3% Iranian 2%
- Foreign-born
- 4% · Canada, South Korea, China
- Languages at home
- 94% English-only · Spanish 2% Other Indo-European 1% Russian/Polish/Slavic 1%
Political lean MEDSL · McDonough
- 2024 margin
- R (+18.9) · D 39.7% · R 58.5% · Other 1.8%
- 2008→2024 swing
- -24.4pp toward R · 2008: 5.6pp · 2024: -18.9pp
- All cycles
- 2024: R+18.9 2020: R+16.6 2016: R+11.7 2012: R+1.5 2008: D+5.6
Not yet ingested
- Civics
- —
Market trends
- HPI YoY
- ▼ -70.20%
- Current HPI
- 140.4351
- Rent YoY
- —
- Metro
- Macomb, IL
- State GDP YoY
- ▲ 1.59%
- F500 in state
- 60
Industry mix (Fortune 500 HQ in IL)
| Industry | F500 HQs | Revenue |
|---|---|---|
| Insurance | 4 | $201B |
|
||
| Consumer Goods | 4 | $87B |
|
||
| Industrial Machinery | 3 | $64B |
|
||
| Healthcare | 2 | $55B |
|
||
| Retail / Pharmacy | 1 | $148B |
|
||
| Agriculture / Food | 1 | $86B |
|
||
Price history
+25.2% since first listed5 events — show timeline
- 2026-03-31 Pending — RMLSA as Distributed by MLS Grid
- 2026-03-26 Listed $75,000 RMLSA as Distributed by MLS Grid
- 2019-08-02 Sold (Public Records) $55,500 Public Records
- 2019-07-29 Sold (MLS) $55,500 RMLSA as Distributed by MLS Grid
- 2018-10-15 Listed $59,900 RMLSA as Distributed by MLS Grid
Property tax history
-1.1%/yrLatest (2024): $1,415 · -0.4% YoY. Source: county tax records.
Cash-flow waterfall
monthlySold comps — $/sqft
last 12 mo · ≤1 miLoading sold comps…