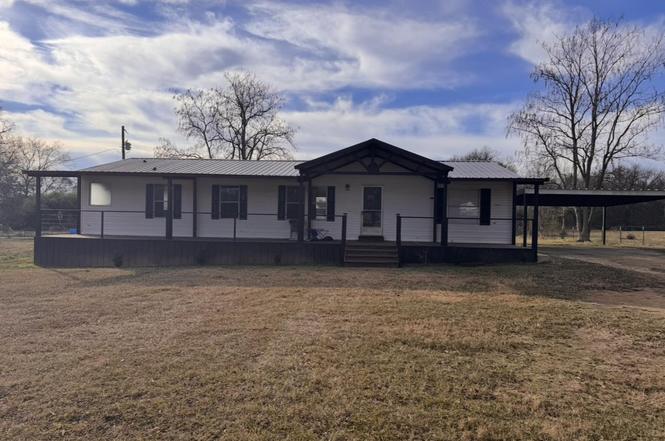
5443 Fm 1000
Mount Pleasant, TX 75455
$164,900C
4 bd · 2.0 ba ·
1,568 sqft ·
Built 2000
· Manufactured
· Pending
· 153 DOM
Cashflow @ list (25.0% down · 7.5%)
Estimated rent
$1,726/mo
Mortgage (P&I)
−$865
Tax + insurance
−$275
HOA
−$0
Vac / Maint / Mgmt
−$363
Net cashflow
$224/mo
Annual
$2,691/yr
Cap rate
7.92%
Cash-on-cash
5.83%
DSCR
1.26
1% rule
1.05%
Cash to close
$46,172
Investor read
- This is a 4-bed/2.0-bath manufactured listed at $165k. Condition is rated good.
- At list price, monthly cash flow is $224 ($3k/yr) — positive.
- The deal already cash-flows at list — no discount required.
- Meets the 1% rule at list price ($2k rent vs $165k).
- It's been on market 153 days — a 12% lower offer ($145k) is reasonable based on typical stale-listing flexibility.
- Recommended offer: $145k (12.0% below list) — sets the bar for market timing.
- Local home prices are declining (-3.0%/yr); year-one equity from $1k of loan paydown is wiped out by about $5k of value loss. Plan a longer hold.
- Location reads 77/100 on livability (#81 in TX, #2,808 nationally) — a middle-class / working-renter tenant base. Strengths: cost of living A+, housing A+, health & safety A+; Watch: employment C-, amenities D-, commute F.
- Chapel Hill ISD (rural): math 52% / reading 50% proficiency, ranked #149 of 826 in TX (top 18%) — acceptable for families but not a draw, mixed tenant base, ~2y average lease.
- Zoned schools: Chapel Hill El (math 57% / reading 57%, grade C+, #505 of 4,322 statewide, top 13%, 483 students, 54% FRL); Chapel Hill J H (math 43% / reading 45%, grade D, #512 of 1,662 statewide, top 32%, 236 students, 47% FRL); Chapel Hill H S (math 67% / reading 57%, grade B-, #237 of 1,632 statewide, top 16%, 342 students, 43% FRL) — zoned schools at 48% FRL track the district average.
- Market conditions: 384 active listings in the ZIP; 47 units permitted in Titus County in 2024 (10 in 5+ unit buildings).
- Climate carrying-cost: major wind risk, 27% chance of damaging wind over 30y; major wildfire risk; extreme-heat days projected 7→23/yr by 2055 (HVAC capex compounding) — expect insurance premiums to compound above CPI over the hold.
- Cap rate 7.9% vs local median 3.1% in Mount Pleasant — top-decile yield for the area; either an underpriced asset or a hidden risk that comps aren't pricing in. Stress-test before assuming the spread holds.
- This rent runs 37% of the median local income ($56k/yr) — at the standard rent-burdened threshold; future hikes will face affordability resistance.
Questions for listing agent
- It's been on market 153 days. Have you received any prior offers? Is the seller open to a 12% concession, seller financing, or rate buy-down credit?
- Why hasn't it sold? Are there any deal-killer items the seller is aware of (foundation, flood, title, zoning, code violations)?
- Is there a deadline driving the sale (1031 exchange, divorce, estate, relocation)? That informs how much negotiation room exists.
- Schools are D-rated, which usually means shorter tenancies and higher turnover. Who's the typical renter profile here, and what's been the actual vacancy rate?
- What's the average days-on-market for RENTAL listings here right now (not sales)? A rising rental-DOM trend means longer vacancies and softer asking-rent achievability than the comps imply.
- What's the recent tenant-quality profile in this submarket — average credit score on applications, eviction rate, late-payment / NSF rate, and stable-employment percentage? A property-management company in the area should have these aggregated.
- How much new for-sale + rental construction is in the pipeline within 1–3 miles? Heavy new supply typically softens prices + rents 12–24 months out; constrained supply supports both.
CashFlowRE · CFR-MJVTBZ51VJMDJ9
· Data 5 days ago
cashflowre.app · 2026-05-29