5443 Fm 1000 · Mount Pleasant, TX
Flood risk 1/10 · Minimal
- FEMA flood zone
- X (unshaded)
- Chance of flooding over 30 yrs
- 0.0%
- Est. flood insurance / yr
- $507 – $1,088
Fire risk 6/10 · Moderate
- Est. fire insurance / yr
- $1,222 – $2,270
Heat risk 7/10 · Major
- Hot days now (above 111°F)
- 7 days/yr
- Hot days in 30 yrs
- 23 days/yr
Wind risk 6/10 · Moderate
- Chance of severe wind over 30 yrs
- 27.0%
Air-quality risk 2/10 · Minimal
- Unhealthy air days now
- 1 days/yr
- Unhealthy air days in 30 yrs
- 1 days/yr
Risk factors via First Street. Map © Google.
Why this score? — see what drove the C grade
The composite is a weighted blend of 9 inputs, each scored 0–100. Each bar is that input's sub-score; the figure is the points it added to the 100-point composite (weight × sub-score).
- Cash flow +20.7/30.0
- ARV discount +7.5/15.0
- DSCR +6.6/10.0
- 1% rule +5.5/10.0
- Schools +4.4/10.0
- Condition / age +4.0/5.0
- Livability +3.9/5.0
- Rent growth +2.5/5.0
- Appreciation +0.0/10.0
$164,900
🖨 Deal sheet (PDF) 📄 Offer letter ✓ Due diligence
Listing remarks
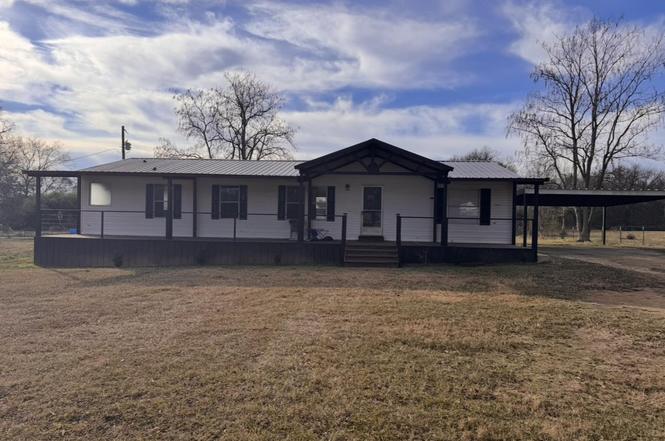
Perfect starter home located just outside the city limits, offering the peace of country living with the convenience of nearby amenities. This well-maintained home features a functional layout, comfortable living spaces, and room to make it your own. Enjoy a quieter setting with plenty of outdoor space, ideal for first-time buyers or those looking to downsize without sacrificing location.
Key facts
- Country living
- Quieter setting
- Functional layout
Tags
Property features AI
Finance
- Financial info: Annual tax amount reported
Exterior
- Utilities: Lot approximately 0.86 acre
- Home design: Single-story manufactured (mobile) home; Residential property
- Construction: Metal siding; Aluminum/metal roof
- Exterior features: Deck; Porch
Interior
- Kitchen: Electric oven; Electric range
- Bathrooms: 2 full bathrooms
- Interior features: Ceiling fans; Central air conditioning; Central electric heating; Electric oven and electric range
Neighborhood map
What this means for you Summary
Snapshot
- This is a 4-bed/2.0-bath manufactured listed at $165k. Condition is rated good.
Deal economics
- At list price, monthly cash flow is $224 ($3k/yr) — positive.
- The deal already cash-flows at list — no discount required.
- Meets the 1% rule at list price ($2k rent vs $165k).
- Recommended offer: $145k (12.0% below list) — sets the bar for market timing.
- Cap rate 7.9% vs local median 3.4% in Mount Pleasant — top-decile yield for the area; either an underpriced asset or a hidden risk that comps aren't pricing in. Stress-test before assuming the spread holds.
Location & tenants
- Location reads 77/100 on livability (#81 in TX, #2,808 nationally) — a middle-class / working-renter tenant base. Strengths: cost of living A+, housing A+, health & safety A+; Watch: employment C-, amenities D-, commute F.
- Chapel Hill ISD (rural): math 52% / reading 50% proficiency, ranked #149 of 826 in TX (top 18%) — acceptable for families but not a draw, mixed tenant base, ~2y average lease.
- Zoned schools: Chapel Hill El (math 57% / reading 57%, grade C+, #505 of 4,322 statewide, top 13%, 483 students, 54% FRL); Chapel Hill J H (math 43% / reading 45%, grade D, #512 of 1,662 statewide, top 32%, 236 students, 47% FRL); Chapel Hill H S (math 67% / reading 57%, grade B-, #237 of 1,632 statewide, top 16%, 342 students, 43% FRL) — zoned schools at 48% FRL track the district average.
- Market conditions: 384 active listings in the ZIP; 47 units permitted in Titus County in 2024 (10 in 5+ unit buildings).
- This rent runs 37% of the median local income ($56k/yr) — at the standard rent-burdened threshold; future hikes will face affordability resistance.
Forward outlook
- Local home prices are declining (-3.0%/yr); year-one equity from $1k of loan paydown is wiped out by about $5k of value loss. Plan a longer hold.
Negotiation context
- It's been on market 153 days — a 12% lower offer ($145k) is reasonable based on typical stale-listing flexibility.
Risks & watch-outs
- Climate carrying-cost: major wind risk, 27% chance of damaging wind over 30y; major wildfire risk; extreme-heat days projected 7→23/yr by 2055 (HVAC capex compounding) — expect insurance premiums to compound above CPI over the hold.
Questions for the listing agent
- It's been on market 153 days. Have you received any prior offers? Is the seller open to a 12% concession, seller financing, or rate buy-down credit?
- Why hasn't it sold? Are there any deal-killer items the seller is aware of (foundation, flood, title, zoning, code violations)?
- Is there a deadline driving the sale (1031 exchange, divorce, estate, relocation)? That informs how much negotiation room exists.
- Schools are D-rated, which usually means shorter tenancies and higher turnover. Who's the typical renter profile here, and what's been the actual vacancy rate?
- What's the average days-on-market for RENTAL listings here right now (not sales)? A rising rental-DOM trend means longer vacancies and softer asking-rent achievability than the comps imply.
- What's the recent tenant-quality profile in this submarket — average credit score on applications, eviction rate, late-payment / NSF rate, and stable-employment percentage? A property-management company in the area should have these aggregated.
- How much new for-sale + rental construction is in the pipeline within 1–3 miles? Heavy new supply typically softens prices + rents 12–24 months out; constrained supply supports both.
Investment metrics
- 1% rule
- 1.05% ✓
- Cap rate
- 7.92%
- Cash-on-cash
- 5.83%
- DSCR
- 1.26
- GRM
- 8.0
CMA / ARV
No comps found within radius.
Projected returns pro-forma
-3.0% appreciation · 3.0% rent growth · sell at horizon
- IRR
- -7.3%
- Equity multiple
- 0.73×
- Total profit
- $-12,411
- Equity at exit
- $24,587
- IRR
- 2.3%
- Equity multiple
- 1.17×
- Total profit
- $7,691
- Equity at exit
- $14,258
Cash invested: $46,172 (down + closing). Projections, not guarantees.
Landlord ↔ Tenant lean methodology
- Overall (STATE)
- 87 Strongly Landlord-Friendly
- State Texas
- 87 Strongly Landlord-Friendly · R+5
- County
- — inherits STATE
- City
- — inherits STATE
ZIP-level market 75455
- Home prices YoY
- -27.0%
- Active inventory
- 384
- Price-to-rent
- 8.0×
Monthly cashflow live
- Estimated rent
- $1,726 medium interval (Pro) →
- Mortgage (P&I)
- −$865
- Tax est. 1.5%
- −$206 /mo · $2,474/yr
- Insurance
- −$69
- HOA
- −$0
- Vacancy / Maint / Mgmt
- −$363
- Net cashflow
- $224
Break-even live
Sensitivity live
| Price | -10% $338 | -5% $281 | +0% $224 | +5% $167 | +10% $110 |
|---|---|---|---|---|---|
| Rent | -10% $88 | -5% $156 | +0% $224 | +5% $292 | +10% $361 |
| Rate | -1.0pp $307 | -0.5pp $266 | base $224 | +0.5pp $182 | +1.0pp $138 |
UW: 25.0% down · 7.5% · 30yr · 1.5% tax · 5.0% vac · 8.0% maint · 8.0% mgmt
Financing live
Cash to close
- Down payment
- $41,225
- Closing costs
- $4,947
- Reserves months
- —
- Total cash needed
- —
Loan-product check · same deal, 3 products live
Conventional
25% down · 7.5% · 30yr
- Down + closing
- —
- Monthly P&I
- —
- Monthly cashflow
- —
- DSCR
- —
- Eligible?
- —
Personal DTI + credit; lowest rate.
DSCR
20% down · 8.5% · 30yr
- Down + closing
- —
- Monthly P&I
- —
- Monthly cashflow
- —
- DSCR
- —
- Eligible?
- —
No personal income docs; deal must DSCR.
Hard money
10% down · 12.0% · 12mo
- Down + closing
- —
- Monthly P&I
- —
- Monthly cashflow
- —
- DSCR
- —
- Eligible?
- —
Short-term bridge; refi at stabilization.
Listing history 2 events
-
2026-06-17remarks 391-char remark
-
2026-06-17$164,900 Pending 153 DOM
ⓘ Source: listings_history table (triggers on properties + properties_extension) + one-shot
backfill from property_details.listing_events for pre-trigger history.
Climate risk First Street
- Flood 1/10 Low FEMA zone X (unshaded) · 0% chance over 30 yrs
- Wildfire 6/10 Major
- Heat 7/10 Severe 7 d/yr ≥111°F today · 23 d/yr by 30 yrs out
- Wind 6/10 Major 27% chance of damaging wind over 30 yrs
- Air quality 2/10 Low 1 unhealthy d/yr today · 1 by 30 yrs out
Nearby sold comps map
Loading sold comps map…
Walkable amenities ~0.75 mi
Loading nearby amenities…
Taxation est. · year 1
- Rental income
- $20,717
- − Mortgage interest
- −$9,237
- − Property taxes
- −$2,474
- − Insurance
- −$824
- − Repairs & maintenance
- −$1,657
- − Management
- −$1,657
- − Depreciation
- −$4,797
- Taxable income
- $70
- Est. tax owed @ 24.0%
- −$17
- After-tax cash flow
- $2,674/yr
For passive investors: Depreciation is non-cash, so a rental often shows a tax loss while cash-flowing — sheltering income. Rental losses are passive: they offset passive income freely, and up to $25,000/yr can offset ordinary (W-2) income if you actively participate and your MAGI is under $100k (phasing out to $0 by $150k); unused losses carry forward. On sale, claimed depreciation is recaptured at up to 25%, and gains may owe capital-gains tax (a 1031 exchange can defer both). Figures are a year-1 estimate at your 24.0% rate — not tax advice; consult a CPA.
Condition & rehab AI · 13 photos
This well-maintained mobile home is in good condition with a good ROI potential for both resale and rental.
Value-add opportunities
- Both Paint exterior trim — Enhances curb appeal and value
- Both Clean gutters — Improves drainage and property value
Renovation cost estimate screening
Value-add ROI direction
- Both Paint exterior trim — Enhances curb appeal and value ↑
- Both Clean gutters — Improves drainage and property value ↑
ⓘ Cost ranges are severity-bucket heuristics (US national rule-of-thumb). Get contractor quotes + a written scope before underwriting a rehab budget.
Schools (NCES district)
- District
- Chapel Hill ISD
- NCES district ID
- 4813680
- Math proficiency
- 52% ▼ -6.00%
- Reading proficiency
- 50% ▼ -4.00%
- Median HH income
- $55,405
- Composite
- 44.15/100
- National rank
- #2862
- State rank
- #149 of 826 in TX
Livability — Mount Pleasant
- Score
- 77/100
- State rank
- #81
- US rank
- #2808
Category grades
Schools grade is shown separately in the Schools card above.
Census & demographics
- County
- Titus County · 26,903 people
- City population
- 26,903
- Metro
- Mount Pleasant, TX
- Population (ZIP)
- 26,903
- Household income
- $56,163
- Rent vs Own
- Severe rent burden
- 758.0
Population outlook (Titus County) Hauer SSP2
- Today (2025)
- 33,205 people
- By 2030
- 33,187 · -0.1%
- By 2040
- 32,931 · -0.8%
- By 2050
- 32,231 · -2.9%
- By 2075
- 29,507 · -11.1%
- By 2100
- 25,369 · -23.6%
Race, ethnicity, and origin ACS 2023
- Neighborhood character
- Diverse neighborhood (Simpson 0.61)
- Race & ethnicity
- Hispanic / Latino 45% White 42% Two or more races 15% Black 10% Asian 1%
- Hispanic origin (detail)
- Mexican 42%
- Common ancestry
- Lithuanian 1% Slovak 1% Italian 1%
- Foreign-born
- 18% · Canada, Vietnam
- Languages at home
- 61% English-only · Spanish 37% Vietnamese 1%
Political lean MEDSL · Titus
- 2024 margin
- Solid R (+54.7) · D 22.3% · R 77.0%
- 2008→2024 swing
- -23.5pp toward R · 2008: -31.2pp · 2024: -54.7pp
- All cycles
- 2024: R+54.7 2020: R+44.7 2016: R+42.1 2012: R+39.0 2008: R+31.2
Not yet ingested
- Civics
- —
Market trends
- HPI YoY
- ▼ -79.66%
- Current HPI
- 215.4205
- Rent YoY
- —
- Metro
- Mount Pleasant, TX
- State GDP YoY
- ▲ 3.95%
- F500 in state
- 110
Industry mix (Fortune 500 HQ in TX)
| Industry | F500 HQs | Revenue |
|---|---|---|
| Energy | 16 | $1,198B |
|
||
| Technology | 5 | $198B |
|
||
| Engineering / Construction | 4 | $72B |
|
||
| Energy Services | 3 | $60B |
|
||
| Utilities | 3 | $41B |
|
||
| Healthcare | 2 | $330B |
|
||
Price history
2 events — show timeline
- 2026-06-16 Pending — GTAR
- 2026-01-14 Listed $164,900 GTAR
Cash-flow waterfall
monthlySold comps — $/sqft
last 12 mo · ≤1 miLoading sold comps…