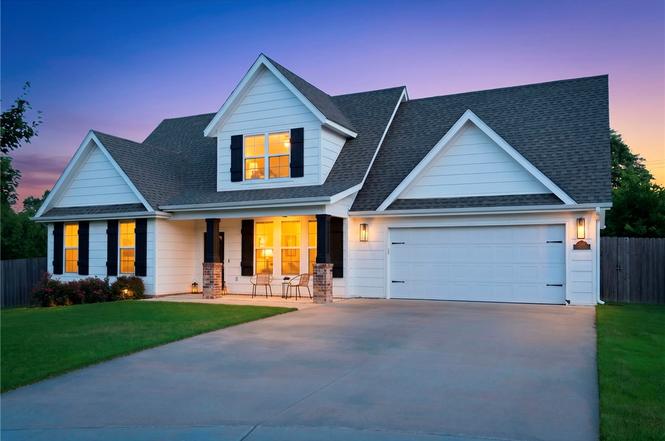
1200 St. Johns Wood
Cave Springs, AR 72718
$559,000D
4 bd · 2.5 ba ·
2,272 sqft ·
Built 2021
· SingleFamily
· Active
· 1 DOM
Cashflow @ list (25.0% down · 7.5%)
Estimated rent
$3,522/mo
Mortgage (P&I)
−$2,931
Tax + insurance
−$588
HOA
−$0
Vac / Maint / Mgmt
−$740
Net cashflow
$-737/mo
Annual
$-8,847/yr
Cap rate
4.71%
Cash-on-cash
-5.65%
DSCR
0.75
1% rule
0.63%
Cash to close
$156,520
Investor read
- This is a 4-bed/2.5-bath single-family listed at $559k.
- At list price, monthly cash flow is $-737 ($-9k/yr) — negative.
- To cash-flow at today's rent, offer at most $429k (23.3% below list).
- To meet the 1% rule (rent ≥ 1% of price), the offer needs to be $352k (37.0% below list).
- Only 1 days on market — expect competitive offers; lowballing is unlikely to land.
- Recommended offer: $352k (37.0% below list) — sets the bar for 1% rule.
- In year one you build about $60k of equity ($4k loan paydown + $56k appreciation (10.0% local appreciation)).
- Location reads 71/100 on livability (#41 in AR) — a middle-class / working-renter tenant base. Strengths: crime A+, employment A+, housing A+; Watch: cost of living C-, schools D, amenities F.
- Bentonville School District (urban): math 59% / reading 59% proficiency, ranked #3 of 238 in AR (top 1%) — acceptable for families but not a draw, mixed tenant base, ~2y average lease.
- Market conditions: 111 active listings in the ZIP; 11 comparable units currently listed for rent nearby; rentals at typical pace (median 14d on market — plan ~3-4 weeks tenant-placement turnaround); 4,359 units permitted in Benton County in 2024 (402 in 5+ unit buildings).
- Benton County population projected at +56% by 2050 — long-run rental-demand tailwind backs the buy-and-hold thesis.
- 2 sale attempts since 5y ago with the ask held roughly flat each time — persistent listings suggest the price (not the market) is what's stuck; bring a comps-based counter.
- Current owner paid $355k; list at $559k implies a 57% gain — meaningful room to come down on a strong offer.
- By year 2, paydown + projected appreciation supports a ~$96k cash-out refi (75% LTV) — recoverable capital for the next deal without selling this one.
- Climate carrying-cost: extreme-heat days projected 7→21/yr by 2055 (HVAC capex compounding) — expect insurance premiums to compound above CPI over the hold.
- Cap rate 4.7% vs local median 3.4% in Cave Springs — top-decile yield for the area; either an underpriced asset or a hidden risk that comps aren't pricing in. Stress-test before assuming the spread holds.
Questions for listing agent
- What do current leases actually rent for vs. the listed asking? Can we see a recent rent roll and the last 12 months of T-12 income?
- Is there a deadline driving the sale (1031 exchange, divorce, estate, relocation)? That informs how much negotiation room exists.
- Schools are D-rated, which usually means shorter tenancies and higher turnover. Who's the typical renter profile here, and what's been the actual vacancy rate?
- The area grade is low — what's the realistic commute time and amenity access for the typical tenant pool here? Any planned neighborhood developments (good or bad) we should know about?
- What's the average days-on-market for RENTAL listings here right now (not sales)? A rising rental-DOM trend means longer vacancies and softer asking-rent achievability than the comps imply.
- What's the recent tenant-quality profile in this submarket — average credit score on applications, eviction rate, late-payment / NSF rate, and stable-employment percentage? A property-management company in the area should have these aggregated.
- How much new for-sale + rental construction is in the pipeline within 1–3 miles? Heavy new supply typically softens prices + rents 12–24 months out; constrained supply supports both.
CashFlowRE · CFR-MM300R3WT17FJG
· Data 2 days ago
cashflowre.app · 2026-05-29