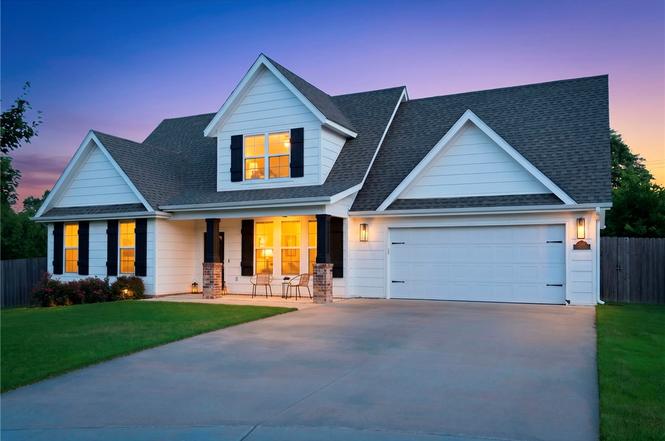
1200 St. Johns Wood · Cave Springs, AR
Flood risk 1/10 · Minimal
- FEMA flood zone
- X (unshaded)
- Chance of flooding over 30 yrs
- 0.0%
- Est. flood insurance / yr
- $507 – $1,088
Fire risk 4/10 · Minor
- Est. fire insurance / yr
- $1,499 – $2,785
Heat risk 5/10 · Moderate
- Hot days now (above 104°F)
- 7 days/yr
- Hot days in 30 yrs
- 21 days/yr
Wind risk 2/10 · Minimal
- Chance of severe wind over 30 yrs
- 2.0%
Air-quality risk 1/10 · Minimal
- Unhealthy air days now
- 0 days/yr
- Unhealthy air days in 30 yrs
- 0 days/yr
Risk factors via First Street. Map © Google.
Why this score? — see what drove the D grade
The composite is a weighted blend of 9 inputs, each scored 0–100. Each bar is that input's sub-score; the figure is the points it added to the 100-point composite (weight × sub-score).
- Appreciation +10.0/10.0
- Cash flow +7.3/30.0
- ARV discount +6.7/15.0
- Schools +5.2/10.0
- Livability +3.6/5.0
- Rent growth +2.5/5.0
- Condition / age +2.5/5.0
- DSCR +1.5/10.0
- 1% rule +1.3/10.0
$559,000
🖨 Deal sheet 📄 Offer letter ✓ Due diligence
Listing remarks MLS
New craftsman style home in one of Northwest Arkansas most popular & desirable neighborhoods. Great floorplan with master bedroom on main level and 3 beds up. 4th bedroom can also be a great media / bonus room. Conveniently located to all of NWA. Come check out the quality and craftsmanship in this great new home for sale in Hyde Park. Great open floor layout with beautiful finishes. Bentonville school district, community pool/park/trails and garden. WELCOME HOME!
Key facts
- Community amenities
- Craftsman-style home
- Open-concept layout
Tags
Property features AI
Finance
- HOA & community: Monthly association fee; Community has curbs and sidewalks; Near fire station, hospital, schools; Nearby park, shopping
Exterior
- Parking: Attached garage; Two covered parking spaces
- Utilities: Public water; Sewer available; Electricity available; Natural gas available; Cable available
- Home design: Two stories; Residential zoning; Resale (less than 25 years old); Architectural shingle roof
- Construction: Concrete construction; Slab foundation
- Exterior features: Concrete driveway; Deck; Partial privacy wood fencing; Landscaped; Cleared; Level lot; Near park; Subdivision; Cul-de-sac; Central business district; Industrial park
Interior
- Kitchen: Dishwasher; Gas cooktop; Range hood; Microwave; Disposal; Plumbed for ice maker; Hot water circulator; Electric water heater
- Flooring: Carpet; Tile; Wood
- Bathrooms: Two full bathrooms; One half bathroom
- Heating & cooling: Central heating (gas); Central air conditioning (electric)
- Interior features: Attic; Ceiling fan(s); Eat-in kitchen; Granite counters; Storage; Walk-in closet(s)
- Laundry & utility: Washer hookup; Dryer hookup
Neighborhood map
What this means for you Summary
Snapshot
- This is a 4-bed/2.5-bath single-family listed at $559k.
Deal economics
- At list price, monthly cash flow is $-737 ($-9k/yr) — negative.
- To cash-flow at today's rent, offer at most $429k (23.3% below list).
- To meet the 1% rule (rent ≥ 1% of price), the offer needs to be $352k (37.0% below list).
- Recommended offer: $352k (37.0% below list) — sets the bar for 1% rule.
- Cap rate 4.7% vs local median 3.4% in Cave Springs — top-decile yield for the area; either an underpriced asset or a hidden risk that comps aren't pricing in. Stress-test before assuming the spread holds.
Location & tenants
- Location reads 71/100 on livability (#41 in AR) — a middle-class / working-renter tenant base. Strengths: crime A+, employment A+, housing A+; Watch: cost of living C-, schools D, amenities F.
- Bentonville School District (urban): math 59% / reading 59% proficiency, ranked #3 of 238 in AR (top 1%) — acceptable for families but not a draw, mixed tenant base, ~2y average lease.
- Market conditions: 111 active listings in the ZIP; 11 comparable units currently listed for rent nearby; rentals at typical pace (median 14d on market — plan ~3-4 weeks tenant-placement turnaround); 4,359 units permitted in Benton County in 2024 (402 in 5+ unit buildings).
Forward outlook
- In year one you build about $60k of equity ($4k loan paydown + $56k appreciation (10.0% local appreciation)).
- Benton County population projected at +56% by 2050 — long-run rental-demand tailwind backs the buy-and-hold thesis.
- By year 2, paydown + projected appreciation supports a ~$96k cash-out refi (75% LTV) — recoverable capital for the next deal without selling this one.
Negotiation context
- Only 1 days on market — expect competitive offers; lowballing is unlikely to land.
- 2 sale attempts since 5y ago with the ask held roughly flat each time — persistent listings suggest the price (not the market) is what's stuck; bring a comps-based counter.
- Current owner paid $355k; list at $559k implies a 57% gain — meaningful room to come down on a strong offer.
Risks & watch-outs
- Climate carrying-cost: extreme-heat days projected 7→21/yr by 2055 (HVAC capex compounding) — expect insurance premiums to compound above CPI over the hold.
Questions for the listing agent
- What do current leases actually rent for vs. the listed asking? Can we see a recent rent roll and the last 12 months of T-12 income?
- Is there a deadline driving the sale (1031 exchange, divorce, estate, relocation)? That informs how much negotiation room exists.
- Schools are D-rated, which usually means shorter tenancies and higher turnover. Who's the typical renter profile here, and what's been the actual vacancy rate?
- The area grade is low — what's the realistic commute time and amenity access for the typical tenant pool here? Any planned neighborhood developments (good or bad) we should know about?
- What's the average days-on-market for RENTAL listings here right now (not sales)? A rising rental-DOM trend means longer vacancies and softer asking-rent achievability than the comps imply.
- What's the recent tenant-quality profile in this submarket — average credit score on applications, eviction rate, late-payment / NSF rate, and stable-employment percentage? A property-management company in the area should have these aggregated.
- How much new for-sale + rental construction is in the pipeline within 1–3 miles? Heavy new supply typically softens prices + rents 12–24 months out; constrained supply supports both.
Investment metrics
- 1% rule
- 0.63% ✗
- Cap rate
- 4.71%
- Cash-on-cash
- -5.65%
- DSCR
- 0.75
- GRM
- 13.2
CMA / ARV
- ARV (on-the-fly)
- $549,824
- Comps found
- 12
Show comp detail 12 sales within ~0.75 mi
| Address | Dist | Beds/Ba | Sqft | Sold | Price | $/sf | Match |
|---|---|---|---|---|---|---|---|
| 6614 W Braebourne Dr | 0.09mi | 4/2.0 | 2,344 (+3%) | 1mo | $575,000 | $245 | 88 |
| 5500 Lanshire Dr | 0.13mi | 4/2.5 | 2,341 (+3%) | 3mo | $605,000 | $258 | 87 |
| 5701 S 66th St | 0.21mi | 3/2.5 (-1) | 2,228 (-2%) | 0mo | $510,000 | $229 | 82 |
| 5900 S 67th St | 0.26mi | 4/3.0 | 2,473 (+9%) | 0mo | $560,000 | $226 | 71 |
| 807 Bellmara Cir | 0.20mi | 4/3.0 | 2,510 (+10%) | 2mo | $581,000 | $231 | 70 |
| 906 Charing Cross | 0.34mi | 4/3.0 | 2,425 (+7%) | 2mo | $587,000 | $242 | 70 |
| 1013 Charing Cross | 0.29mi | 4/2.5 | 2,531 (+11%) | 0mo | $570,000 | $225 | 67 |
| 6201 Tumbler Rdg | 0.57mi | 4/3.0 | 2,403 (+6%) | 1mo | $575,000 | $239 | 61 |
| 6533 W Valley View Rd | 0.54mi | 3/2.0 (-1) | 2,207 (-3%) | 3mo | $498,000 | $226 | 61 |
| 816 Post Way | 0.54mi | 4/2.5 | 2,477 (+9%) | 0mo | $615,000 | $248 | 59 |
| 5222 S Brookmere St | 0.70mi | 3/2.5 (-1) | 2,148 (-6%) | 1mo | $595,000 | $277 | 52 |
| 626 Millwood | 0.72mi | 4/2.5 | 2,097 (-8%) | 2mo | $564,000 | $269 | 52 |
Match score weights: distance 35% · size 25% · config 20% · recency 20%. Top-matched comps best support the ARV.
Projected returns pro-forma
10.0% appreciation · 3.0% rent growth · sell at horizon
- IRR
- 20.3%
- Equity multiple
- 2.64×
- Total profit
- $257,334
- Equity at exit
- $503,591
- IRR
- 18.5%
- Equity multiple
- 6.08×
- Total profit
- $794,417
- Equity at exit
- $1,086,014
Cash invested: $156,520 (down + closing). Projections, not guarantees.
Landlord ↔ Tenant lean methodology
- Overall (STATE)
- 92 Strongly Landlord-Friendly
- State Arkansas
- 92 Strongly Landlord-Friendly · R+14
- County
- — inherits STATE
- City
- — inherits STATE
ZIP-level market 72718
- Home prices YoY
- 14.1%
- Active inventory
- 111
- Price-to-rent
- 13.2×
Monthly cashflow live
- Estimated rent
- $3,522 high interval (Pro) →
- Mortgage (P&I)
- −$2,931
- Tax from tax record
- −$355 /mo · $4,263/yr
- Insurance
- −$233
- HOA
- −$0
- Vacancy / Maint / Mgmt
- −$740
- Net cashflow
- $-737
Break-even live
UW: 25.0% down · 7.5% · 30yr · 1.5% tax · 5.0% vac · 8.0% maint · 8.0% mgmt
Financing live
Cash to close
- Down payment
- $139,750
- Closing costs
- $16,770
- Reserves months
- —
- Total cash needed
- —
Loan-product check · same deal, 3 products live
Conventional
25% down · 7.5% · 30yr
- Down + closing
- —
- Monthly P&I
- —
- Monthly cashflow
- —
- DSCR
- —
- Eligible?
- —
Personal DTI + credit; lowest rate.
DSCR
20% down · 8.5% · 30yr
- Down + closing
- —
- Monthly P&I
- —
- Monthly cashflow
- —
- DSCR
- —
- Eligible?
- —
No personal income docs; deal must DSCR.
Hard money
10% down · 12.0% · 12mo
- Down + closing
- —
- Monthly P&I
- —
- Monthly cashflow
- —
- DSCR
- —
- Eligible?
- —
Short-term bridge; refi at stabilization.
Rent comps 11 comps
| Address | Beds | Baths | Sqft | Rent | $/sqft | DOM | Units | Dist |
|---|---|---|---|---|---|---|---|---|
| 6508 W Stone Lake Dr Unit 1221824P Rogers, AR | 4.0 | 2.5 | 2271 | $7,860 | $3.46 | 14d | 1 | 0.42mi |
| 6502 W Hearth Falls Dr Unit 1221804P Rogers, AR | 4.0 | 2.5 | 2443 | $6,688 | $2.74 | 14d | 1 | 0.43mi |
| 5313 S Stone Bay Ct Rogers, AR | 4.0 | 3.0 | 2110 | $3,300 | $1.56 | 14d | 1 | 0.56mi |
| 6506 W Knoll View Way Rogers, AR | 3.0 | 2.5 | 1746 | $2,700 | $1.55 | 14d | 1 | 0.60mi |
| 5217 S 65th Pl Rogers, AR | 3.0 | 2.5 | 2055 | $2,400 | $1.17 | 23d | 1 | 0.63mi |
| 5217 S 65th Pl Rogers, AR | 3.0 | 2.5 | 2055 | $2,290 | $1.11 | 14d | 1 | 0.63mi |
| 6613 W Valley View Rd Rogers, AR | 4.0 | 2.5 | 2475 | $3,000 | $1.21 | 23d | 1 | 0.64mi |
| 6683 W Valley View Rd Rogers, AR | 4.0 | 2.5 | 2477 | $3,500 | $1.41 | 23d | 1 | 0.66mi |
| 6665 W Valley View Rd Rogers, AR | 3.0 | 2.0 | 1923 | $2,950 | $1.53 | 23d | 1 | 0.70mi |
| 7 S Prairie Dunes Dr Rogers, AR | 3.0 | 2.5 | 1773 | $3,800 | $2.14 | 13d | 1 | 1.39mi |
| 6505 S 50th St Rogers, AR | 4.0 | 2.0 | 1630 | $1,850 | $1.13 | 14d | 1 | 1.50mi |
Listing history 2 events
-
2026-06-18remarks 548-char remark
-
2026-06-18$559,000 Active 1 DOM
ⓘ Source: listings_history table (triggers on properties + properties_extension) + one-shot
backfill from property_details.listing_events for pre-trigger history.
Tax reassessment forecast AR · Resets to sale price
- Current annual tax
- $4,263 · $355/mo
- Projected year-2 tax
- $4,263 · $355/mo
- Expected delta
- $0/yr ($0/mo · 0.0%)
ⓘ Screening estimate from a state-policy table — verify with the county assessor before closing.
Climate risk First Street
- Flood 1/10 Low FEMA zone X (unshaded) · 0% chance over 30 yrs
- Wildfire 4/10 Moderate
- Heat 5/10 Major 7 d/yr ≥104°F today · 21 d/yr by 30 yrs out
- Wind 2/10 Low 2% chance of damaging wind over 30 yrs
- Air quality 1/10 Low 0 unhealthy d/yr today · 0 by 30 yrs out
Nearby sold comps map
Loading sold comps map…
Walkable amenities ~0.75 mi
Loading nearby amenities…
Taxation est. · year 1
- Rental income
- $42,264
- − Mortgage interest
- −$31,313
- − Property taxes
- −$4,263
- − Insurance
- −$2,795
- − Repairs & maintenance
- −$3,381
- − Management
- −$3,381
- − Depreciation
- −$16,262
- Taxable loss
- −$19,131
- Est. tax savings @ 24.0%
- +$4,591
- After-tax cash flow
- $-4,255/yr
For passive investors: Depreciation is non-cash, so a rental often shows a tax loss while cash-flowing — sheltering income. Rental losses are passive: they offset passive income freely, and up to $25,000/yr can offset ordinary (W-2) income if you actively participate and your MAGI is under $100k (phasing out to $0 by $150k); unused losses carry forward. On sale, claimed depreciation is recaptured at up to 25%, and gains may owe capital-gains tax (a 1031 exchange can defer both). Figures are a year-1 estimate at your 24.0% rate — not tax advice; consult a CPA.
Schools (NCES district)
- District
- Bentonville School District
- NCES district ID
- 0503060
- Math proficiency
- 59% ▼ -8.00%
- Reading proficiency
- 59% ▼ -6.00%
- Median HH income
- $66,721
- Composite
- 51.85/100
- National rank
- #1661
- State rank
- #3 of 238 in AR
Livability — Cave Springs
- Score
- 71/100
- State rank
- #41
- US rank
- #6981
Category grades
Schools grade is shown separately in the Schools card above.
Census & demographics
- Census place
- Cave Springs, AR
- City population
- 5,528
- Population (ZIP)
- 5,528
Population outlook (Benton County) Hauer SSP2
- Today (2025)
- 318,683 people
- By 2030
- 353,481 · +10.9%
- By 2040
- 425,280 · +33.4%
- By 2050
- 497,239 · +56.0%
- By 2075
- 662,114 · +107.8%
- By 2100
- 776,431 · +143.6%
Race, ethnicity, and origin ACS 2023
- Neighborhood character
- Predominantly White (69%)
- Race & ethnicity
- White 69% Two or more races 25% Hispanic / Latino 7%
- Hispanic origin (detail)
- Mexican 5%
- Common ancestry
- Slovak 4% Romanian 3% Lithuanian 2%
- Foreign-born
- 3% · Canada
- Languages at home
- 92% English-only · Spanish 6% Other Asian/Pacific 2%
Political lean MEDSL · Benton
- 2024 margin
- Strong R (+27.0) · D 35.2% · R 62.1% · Other 2.7%
- 2008→2024 swing
- +9.6pp toward D · 2008: -36.5pp · 2024: -27.0pp
- All cycles
- 2024: R+27.0 2020: R+26.4 2016: R+34.9 2012: R+40.4 2008: R+36.5
Not yet ingested
- Civics
- —
Market trends
- HPI YoY
- ▲ 41.26%
- Current HPI
- 334.6594
- Rent YoY
- —
- Metro
- —
- State GDP YoY
- ▲ 3.80%
- F500 in state
- 10
Industry mix (Fortune 500 HQ in AR)
| Industry | F500 HQs | Revenue |
|---|---|---|
| Retail | 1 | $681B |
|
||
| Food / Agriculture | 1 | $53B |
|
||
| Retail / Energy | 1 | $22B |
|
||
| Transportation / Logistics | 1 | $12B |
|
||
| Energy | 1 | $4B |
|
||
Price history
+58.7% since first listed3 events — show timeline
- 2026-06-18 Listed $559,000 NWARMLS
- 2021-05-14 Sold (MLS) $355,000 NWARMLS
- 2021-03-16 Listed $352,160 NWARMLS
Property tax history
+12.9%/yrLatest (2025): $4,263 · +2.6% YoY. Source: county tax records.
Cash-flow waterfall
monthlySold comps — $/sqft
last 12 mo · ≤1 miLoading sold comps…