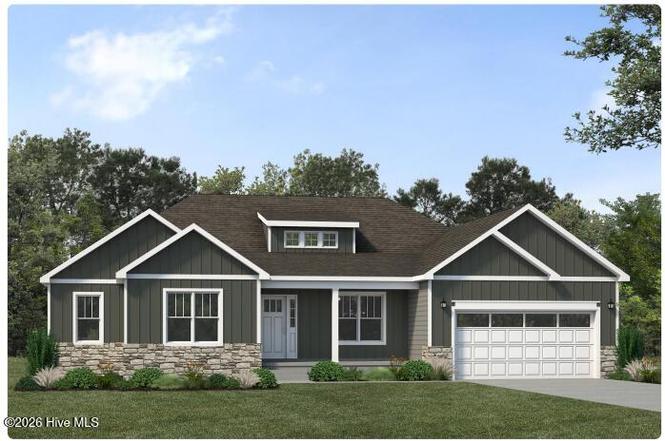
9 Constitution Ct
Broad Creek, NC 28570
$410,275B
4 bd · 3.0 ba ·
2,054 sqft ·
Built 2026
· SingleFamily
· Pending
· 1 DOM
Cashflow @ list (25.0% down · 7.5%)
Estimated rent
$14,912/mo
Mortgage (P&I)
−$2,152
Tax + insurance
−$684
HOA
−$27
Vac / Maint / Mgmt
−$3,131
Net cashflow
$8,918/mo
Annual
$107,014/yr
Cap rate
32.38%
Cash-on-cash
93.16%
DSCR
5.14
1% rule
3.63%
Cash to close
$114,877
Investor read
- This is a 4-bed/3.0-bath single-family listed at $410k.
- At list price, monthly cash flow is $9k ($107k/yr) — positive.
- The deal already cash-flows at list — no discount required.
- Meets the 1% rule at list price ($15k rent vs $410k).
- Only 1 days on market — expect competitive offers; lowballing is unlikely to land.
- Local home prices are declining (-3.0%/yr); year-one equity from $3k of loan paydown is wiped out by about $12k of value loss. Plan a longer hold.
- Location reads 64/100 on livability (#340 in NC) — a middle-class / working-renter tenant base. Strengths: crime A+, cost of living A+, housing A+; Watch: amenities F, commute F, health & safety D-.
- Carteret County Public Schools (rural): math 59% / reading 61% proficiency, ranked #31 of 178 in NC (top 17%) — acceptable for families but not a draw, mixed tenant base, ~2y average lease.
- Zoned schools: Newport Elementary (math 48% / reading 45%, grade D-, #542 of 1,410 statewide, top 39%, 645 students, 100% FRL); Newport Middle (math 39% / reading 56%, grade C-, #140 of 475 statewide, top 30%, 378 students, 98% FRL); West Carteret High (math 82% / reading 71%, grade A-, #89 of 535 statewide, top 16%, 1,146 students, 40% FRL) — zoned schools average 79% FRL vs 39% district-wide (40 pts higher); higher-poverty schools than district average — tighter screening recommended.
- Market conditions: 216 active listings in the ZIP; 935 units permitted in Carteret County in 2024 (360 in 5+ unit buildings).
- Carteret County population projected at +9% by 2050 — modest demand growth; plan on rents tracking national, not racing it.
- At projected returns (-3.0% appreciation + 3.0% rent growth), your $115k cash investment doubles in ~2 years — after that, you're playing with house money.
- Climate carrying-cost: severe wind risk, 99% chance of damaging wind over 30y; moderate wildfire risk; extreme-heat days projected 7→20/yr by 2055 (HVAC capex compounding) — expect insurance premiums to compound above CPI over the hold.
- Cap rate 32.4% vs local median 22.6% in Broad Creek — top-decile yield for the area; either an underpriced asset or a hidden risk that comps aren't pricing in. Stress-test before assuming the spread holds.
- At $14,912/mo this rent would consume 255% of the median local household income ($70k/yr) (locally 461% of renters already pay >50% of income on rent) — very limited rent-growth headroom before tenants either downsize or default.
Questions for listing agent
- What does the HOA fee cover, when was the last increase, and are there any pending special assessments or reserve-fund shortfalls?
- Is there a deadline driving the sale (1031 exchange, divorce, estate, relocation)? That informs how much negotiation room exists.
- Schools are F-rated, which usually means shorter tenancies and higher turnover. Who's the typical renter profile here, and what's been the actual vacancy rate?
- What's the average days-on-market for RENTAL listings here right now (not sales)? A rising rental-DOM trend means longer vacancies and softer asking-rent achievability than the comps imply.
- What's the recent tenant-quality profile in this submarket — average credit score on applications, eviction rate, late-payment / NSF rate, and stable-employment percentage? A property-management company in the area should have these aggregated.
- How much new for-sale + rental construction is in the pipeline within 1–3 miles? Heavy new supply typically softens prices + rents 12–24 months out; constrained supply supports both.
CashFlowRE · CFR-MNWM247D5H9CCE
· Data 3 weeks ago
cashflowre.app · 2026-05-29