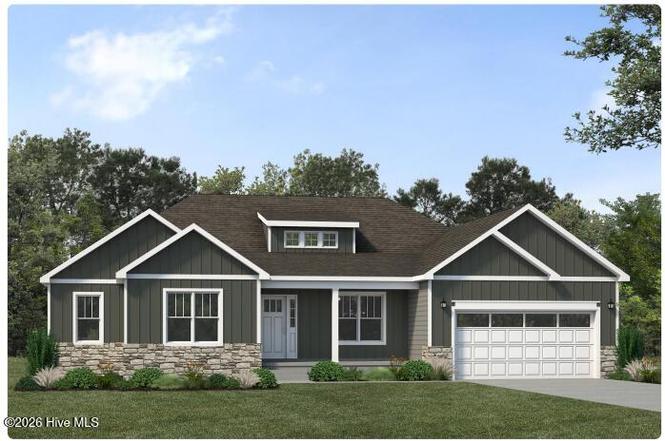
9 Constitution Ct · Broad Creek, NC
Flood risk 1/10 · Minimal
- FEMA flood zone
- X (unshaded)
- Chance of flooding over 30 yrs
- 0.0%
- Est. flood insurance / yr
- $507 – $1,088
Fire risk 5/10 · Moderate
- Est. fire insurance / yr
- $906 – $1,684
Heat risk 9/10 · Severe
- Hot days now (above 102°F)
- 7 days/yr
- Hot days in 30 yrs
- 20 days/yr
Wind risk 8/10 · Major
- Chance of severe wind over 30 yrs
- 99.0%
Air-quality risk 2/10 · Minimal
- Unhealthy air days now
- 2 days/yr
- Unhealthy air days in 30 yrs
- 2 days/yr
Risk factors via First Street. Map © Google.
Why this score? — see what drove the B grade
The composite is a weighted blend of 9 inputs, each scored 0–100. Each bar is that input's sub-score; the figure is the points it added to the 100-point composite (weight × sub-score).
- Cash flow +30.0/30.0
- 1% rule +10.0/10.0
- DSCR +10.0/10.0
- ARV discount +9.9/15.0
- Schools +5.1/10.0
- Livability +3.2/5.0
- Rent growth +2.5/5.0
- Condition / age +2.5/5.0
- Appreciation +0.0/10.0
$410,275
🖨 Deal sheet 📄 Offer letter ✓ Due diligence
Listing remarks
PRE SALE. NO SHOWINGS! The one-story Chatham is a classic to the JC Jackson's Carolina Series. With four bedrooms and three bathrooms this split bedroom home features an impressive entry that showcases your dining room and study just inside the front door, then leads you to the expansive great room open to the breakfast area, and kitchen with a center island. With tall cathedral ceilings and windows across the back of the home that provide views of the backyard, this home was built for entertaining! The owner's bedroom is separate from the secondary bedrooms with easy access to the garage through the conveniently located laundry room.
Key facts
- One story
- Expansive great room
- Impressive entry
Tags
Neighborhood map
What this means for you Summary
Snapshot
- This is a 4-bed/3.0-bath single-family listed at $410k.
Deal economics
- At list price, monthly cash flow is $9k ($107k/yr) — positive.
- The deal already cash-flows at list — no discount required.
- Meets the 1% rule at list price ($15k rent vs $410k).
- Cap rate 32.4% vs local median 22.6% in Broad Creek — top-decile yield for the area; either an underpriced asset or a hidden risk that comps aren't pricing in. Stress-test before assuming the spread holds.
Location & tenants
- Location reads 64/100 on livability (#340 in NC) — a middle-class / working-renter tenant base. Strengths: crime A+, cost of living A+, housing A+; Watch: amenities F, commute F, health & safety D-.
- Carteret County Public Schools (rural): math 59% / reading 61% proficiency, ranked #31 of 178 in NC (top 17%) — acceptable for families but not a draw, mixed tenant base, ~2y average lease.
- Zoned schools: Newport Elementary (math 48% / reading 45%, grade D-, #542 of 1,410 statewide, top 39%, 645 students, 100% FRL); Newport Middle (math 39% / reading 56%, grade C-, #140 of 475 statewide, top 30%, 378 students, 98% FRL); West Carteret High (math 82% / reading 71%, grade A-, #89 of 535 statewide, top 16%, 1,146 students, 40% FRL) — zoned schools average 79% FRL vs 39% district-wide (40 pts higher); higher-poverty schools than district average — tighter screening recommended.
- Market conditions: 216 active listings in the ZIP; 935 units permitted in Carteret County in 2024 (360 in 5+ unit buildings).
- At $14,912/mo this rent would consume 255% of the median local household income ($70k/yr) (locally 461% of renters already pay >50% of income on rent) — very limited rent-growth headroom before tenants either downsize or default.
Forward outlook
- Local home prices are declining (-3.0%/yr); year-one equity from $3k of loan paydown is wiped out by about $12k of value loss. Plan a longer hold.
- Carteret County population projected at +9% by 2050 — modest demand growth; plan on rents tracking national, not racing it.
- At projected returns (-3.0% appreciation + 3.0% rent growth), your $115k cash investment doubles in ~2 years — after that, you're playing with house money.
Negotiation context
- Only 1 days on market — expect competitive offers; lowballing is unlikely to land.
Risks & watch-outs
- Climate carrying-cost: severe wind risk, 99% chance of damaging wind over 30y; moderate wildfire risk; extreme-heat days projected 7→20/yr by 2055 (HVAC capex compounding) — expect insurance premiums to compound above CPI over the hold.
Questions for the listing agent
- What does the HOA fee cover, when was the last increase, and are there any pending special assessments or reserve-fund shortfalls?
- Is there a deadline driving the sale (1031 exchange, divorce, estate, relocation)? That informs how much negotiation room exists.
- Schools are F-rated, which usually means shorter tenancies and higher turnover. Who's the typical renter profile here, and what's been the actual vacancy rate?
- What's the average days-on-market for RENTAL listings here right now (not sales)? A rising rental-DOM trend means longer vacancies and softer asking-rent achievability than the comps imply.
- What's the recent tenant-quality profile in this submarket — average credit score on applications, eviction rate, late-payment / NSF rate, and stable-employment percentage? A property-management company in the area should have these aggregated.
- How much new for-sale + rental construction is in the pipeline within 1–3 miles? Heavy new supply typically softens prices + rents 12–24 months out; constrained supply supports both.
Investment metrics
- 1% rule
- 3.63% ✓
- Cap rate
- 32.38%
- Cash-on-cash
- 93.16%
- DSCR
- 5.14
- GRM
- 2.3
CMA / ARV
- ARV (on-the-fly)
- $433,394
- Comps found
- 12
Show comp detail 12 sales within ~0.75 mi
| Address | Dist | Beds/Ba | Sqft | Sold | Price | $/sf | Match |
|---|---|---|---|---|---|---|---|
| 115 Eudora Dr | 0.19mi | 3/2.5 (-1) | 2,030 (-1%) | 8mo | $425,000 | $209 | 75 |
| 183 Gales Dr | 0.19mi | 3/2.0 (-1) | 2,044 (-0%) | 11mo | $435,000 | $213 | 72 |
| 101 Eudora Dr | 0.16mi | 3/2.5 (-1) | 1,906 (-7%) | 2mo | $425,000 | $223 | 72 |
| 115 Ballantine Grove Ln | 0.37mi | 4/2.0 | 2,016 (-2%) | 12mo | $405,000 | $201 | 66 |
| 110 Ballantine Grove Ln | 0.33mi | 4/2.0 | 1,885 (-8%) | 13mo | $390,000 | $207 | 56 |
| 265 Bay Run | 0.64mi | 3/2.5 (-1) | 2,100 (+2%) | 4mo | $390,000 | $186 | 56 |
| 281 Bay Run | 0.68mi | 3/2.5 (-1) | 2,015 (-2%) | 7mo | $430,000 | $213 | 52 |
| 111 Dixon Pond Dr Lot 96 | 0.37mi | 4/2.0 | 1,774 (-14%) | 16mo | $369,999 | $209 | 43 |
| 210 Jones Ridge Ln Lot 89 | 0.47mi | 4/2.0 | 1,774 (-14%) | 13mo | $374,199 | $211 | 40 |
| 129 Ballantine Grove Ln | 0.38mi | 3/2.0 (-1) | 1,760 (-14%) | 11mo | $387,000 | $220 | 40 |
| 200 Jones Ridge Ln Lot 91 | 0.42mi | 4/2.0 | 1,774 (-14%) | 16mo | $369,999 | $209 | 40 |
| 211 Fawns Path Cir Lot 83 | 0.54mi | 4/2.0 | 1,774 (-14%) | 15mo | $393,000 | $222 | 36 |
Match score weights: distance 35% · size 25% · config 20% · recency 20%. Top-matched comps best support the ARV.
Projected returns pro-forma
-3.0% appreciation · 3.0% rent growth · sell at horizon
- IRR
- 94.0%
- Equity multiple
- 5.37×
- Total profit
- $501,743
- Equity at exit
- $61,173
- IRR
- 96.8%
- Equity multiple
- 11.18×
- Total profit
- $1,169,261
- Equity at exit
- $35,473
Cash invested: $114,877 (down + closing). Projections, not guarantees.
Landlord ↔ Tenant lean methodology
- Overall (STATE)
- 85 Strongly Landlord-Friendly
- State North Carolina
- 85 Strongly Landlord-Friendly · R+3
- County
- — inherits STATE
- City
- — inherits STATE
ZIP-level market 28570
- Home prices YoY
- -16.2%
- Active inventory
- 216
- Price-to-rent
- 2.3×
Monthly cashflow live
- Estimated rent
- $14,912 medium interval (Pro) →
- Mortgage (P&I)
- −$2,152
- Tax est. 1.5%
- −$513 /mo · $6,154/yr
- Insurance
- −$171
- HOA
- −$27
- Vacancy / Maint / Mgmt
- −$3,131
- Net cashflow
- $8,918
Break-even live
UW: 25.0% down · 7.5% · 30yr · 1.5% tax · 5.0% vac · 8.0% maint · 8.0% mgmt
Financing live
Cash to close
- Down payment
- $102,569
- Closing costs
- $12,308
- Reserves months
- —
- Total cash needed
- —
Loan-product check · same deal, 3 products live
Conventional
25% down · 7.5% · 30yr
- Down + closing
- —
- Monthly P&I
- —
- Monthly cashflow
- —
- DSCR
- —
- Eligible?
- —
Personal DTI + credit; lowest rate.
DSCR
20% down · 8.5% · 30yr
- Down + closing
- —
- Monthly P&I
- —
- Monthly cashflow
- —
- DSCR
- —
- Eligible?
- —
No personal income docs; deal must DSCR.
Hard money
10% down · 12.0% · 12mo
- Down + closing
- —
- Monthly P&I
- —
- Monthly cashflow
- —
- DSCR
- —
- Eligible?
- —
Short-term bridge; refi at stabilization.
HOA detail
- Monthly dues
- $27 · $324/yr
Listing history 2 events
-
2026-03-12status Pending
-
2026-03-11$410,275 Active
ⓘ Source: listings_history table (triggers on properties + properties_extension) + one-shot
backfill from property_details.listing_events for pre-trigger history.
Climate risk First Street
- Flood 1/10 Low FEMA zone X (unshaded) · 0% chance over 30 yrs
- Wildfire 5/10 Major
- Heat 9/10 Extreme 7 d/yr ≥102°F today · 20 d/yr by 30 yrs out
- Wind 8/10 Severe 99% chance of damaging wind over 30 yrs
- Air quality 2/10 Low 2 unhealthy d/yr today · 2 by 30 yrs out
Nearby sold comps map
Loading sold comps map…
Walkable amenities ~0.75 mi
Loading nearby amenities…
Taxation est. · year 1
- Rental income
- $178,940
- − Mortgage interest
- −$22,982
- − Property taxes
- −$6,154
- − Insurance
- −$2,051
- − Repairs & maintenance
- −$14,315
- − Management
- −$14,315
- − HOA
- −$324
- − Depreciation
- −$11,935
- Taxable income
- $106,863
- Est. tax owed @ 24.0%
- −$25,647
- After-tax cash flow
- $81,367/yr
For passive investors: Depreciation is non-cash, so a rental often shows a tax loss while cash-flowing — sheltering income. Rental losses are passive: they offset passive income freely, and up to $25,000/yr can offset ordinary (W-2) income if you actively participate and your MAGI is under $100k (phasing out to $0 by $150k); unused losses carry forward. On sale, claimed depreciation is recaptured at up to 25%, and gains may owe capital-gains tax (a 1031 exchange can defer both). Figures are a year-1 estimate at your 24.0% rate — not tax advice; consult a CPA.
Schools (NCES district)
- District
- Carteret County Public Schools
- NCES district ID
- 3700630
- Math proficiency
- 59% ▲ 5.00%
- Reading proficiency
- 61% ▲ 2.00%
- Median HH income
- $48,330
- Composite
- 50.92/100
- National rank
- #1786
- State rank
- #31 of 178 in NC
Livability — Broad Creek
- Score
- 64/100
- State rank
- #340
- US rank
- #13718
Category grades
Schools grade is shown separately in the Schools card above.
Census & demographics
- Census place
- Broad Creek, NC
- County
- Carteret County · 52,389 people
- Metro
- Morehead City, NC
- Population (ZIP)
- 22,197
- Household income
- $70,229
- Rent vs Own
- Severe rent burden
- 461.0
Population outlook (Carteret County) Hauer SSP2
- Today (2025)
- 73,443 people
- By 2030
- 75,344 · +2.6%
- By 2040
- 78,142 · +6.4%
- By 2050
- 80,091 · +9.1%
- By 2075
- 86,120 · +17.3%
- By 2100
- 89,408 · +21.7%
Race, ethnicity, and origin ACS 2023
- Neighborhood character
- Predominantly White (82%)
- Race & ethnicity
- White 82% Hispanic / Latino 7% Two or more races 6% Black 3% Asian 1%
- Hispanic origin (detail)
- Mexican 4%
- Common ancestry
- Slovak 3% Romanian 3% Lithuanian 2%
- Foreign-born
- 5% · Canada, Dominican Republic
- Languages at home
- 92% English-only · Spanish 6% German/W. Germanic 1%
Political lean MEDSL · Carteret
- 2024 margin
- Solid R (+43.1) · D 28.0% · R 71.1%
- 2008→2024 swing
- -8.4pp toward R · 2008: -34.7pp · 2024: -43.1pp
- All cycles
- 2024: R+43.1 2020: R+42.0 2016: R+44.5 2012: R+41.0 2008: R+34.7
Not yet ingested
- Civics
- —
Market trends
- HPI YoY
- ▼ -53.54%
- Current HPI
- 276.6589
- Rent YoY
- —
- Metro
- Morehead City, NC
- State GDP YoY
- ▲ 3.28%
- F500 in state
- 26
Industry mix (Fortune 500 HQ in NC)
| Industry | F500 HQs | Revenue |
|---|---|---|
| Financial Services | 2 | $213B |
|
||
| Retail | 2 | $95B |
|
||
| Industrial Conglomerate | 1 | $38B |
|
||
| Metals / Steel | 1 | $35B |
|
||
| Utilities | 1 | $30B |
|
||
| Industrial Machinery | 1 | $19B |
|
||
Price history
2 events — show timeline
- 2026-03-12 Pending — Hive MLS
- 2026-03-11 Listed $410,275 Hive MLS
Cash-flow waterfall
monthlySold comps — $/sqft
last 12 mo · ≤1 miLoading sold comps…