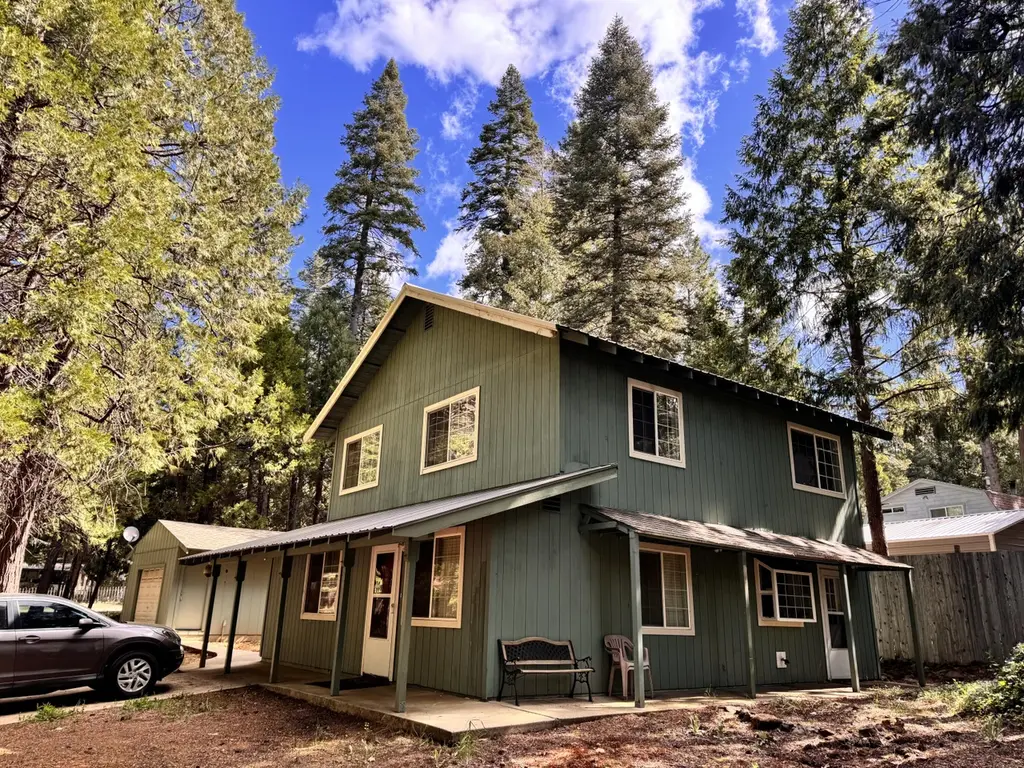
33837 Constellation Dr
Shingletown, CA 96088
$259,000D+
3 bd · 2.0 ba ·
1,568 sqft ·
Built 1985
· SingleFamily
· Active
· 33 DOM
Cashflow @ list (25.0% down · 7.5%)
Estimated rent
$2,114/mo
Mortgage (P&I)
−$1,358
Tax + insurance
−$217
HOA
−$0
Vac / Maint / Mgmt
−$444
Net cashflow
$95/mo
Annual
$1,145/yr
Cap rate
6.73%
Cash-on-cash
1.58%
DSCR
1.07
1% rule
0.82%
Cash to close
$72,520
Investor read
- This is a 3-bed/2.0-bath single-family listed at $259k.
- At list price, monthly cash flow is $95 ($1k/yr) — positive.
- The deal already cash-flows at list — no discount required.
- To meet the 1% rule (rent ≥ 1% of price), the offer needs to be $211k (18.4% below list).
- It's been on market 33 days — a 3% lower offer ($251k) is reasonable based on typical stale-listing flexibility.
- Recommended offer: $211k (18.4% below list) — sets the bar for 1% rule.
- Local home prices are declining (-3.0%/yr); year-one equity from $2k of loan paydown is wiped out by about $8k of value loss. Plan a longer hold.
- Location reads 59/100 on livability (#663 in CA) — a working-class tenant base; expect higher turnover. Strengths: housing A+, crime B+, health & safety B; Watch: amenities F, commute F, cost of living F.
- Shasta Union High (urban): math 41% / reading 67% proficiency, ranked #122 of 517 in CA (top 24%) — acceptable for families but not a draw, mixed tenant base, ~2y average lease; only 16% free/reduced lunch — higher-income household profile.
- Zoned schools: Black Butte Elementary (149 students, 74% FRL); Black Butte Junior High (75 students, 65% FRL); Foothill High (math 45% / reading 70%, grade C, #232 of 1,170 statewide, top 20%, 1,398 students, 42% FRL) — zoned schools average 61% FRL vs 16% district-wide (45 pts higher); higher-poverty schools than district average — tighter screening recommended.
- Market conditions: 124 active listings in the ZIP; 246 units permitted in Shasta County in 2024 (0 in 5+ unit buildings).
- Shasta County population projected to shrink 9% by 2050 — rents likely to lag national; underwrite the cash flow, not the appreciation.
- Climate carrying-cost: major wildfire risk — expect insurance premiums to compound above CPI over the hold.
- Cap rate 6.7% vs local median 4.7% in Shingletown — top-decile yield for the area; either an underpriced asset or a hidden risk that comps aren't pricing in. Stress-test before assuming the spread holds.
Questions for listing agent
- It's been on market 33 days. Have you received any prior offers? Is the seller open to a 18% concession, seller financing, or rate buy-down credit?
- Is there a deadline driving the sale (1031 exchange, divorce, estate, relocation)? That informs how much negotiation room exists.
- Schools are F-rated, which usually means shorter tenancies and higher turnover. Who's the typical renter profile here, and what's been the actual vacancy rate?
- The area grade is low — what's the realistic commute time and amenity access for the typical tenant pool here? Any planned neighborhood developments (good or bad) we should know about?
- What's the average days-on-market for RENTAL listings here right now (not sales)? A rising rental-DOM trend means longer vacancies and softer asking-rent achievability than the comps imply.
- What's the recent tenant-quality profile in this submarket — average credit score on applications, eviction rate, late-payment / NSF rate, and stable-employment percentage? A property-management company in the area should have these aggregated.
- How much new for-sale + rental construction is in the pipeline within 1–3 miles? Heavy new supply typically softens prices + rents 12–24 months out; constrained supply supports both.
CashFlowRE · CFR-MPHVAVANH14WCS
· Data 1 min ago
cashflowre.app · 2026-05-29