33837 Constellation Dr · Shingletown, CA
Flood risk 1/10 · Minimal
- FEMA flood zone
- X (unshaded)
- Chance of flooding over 30 yrs
- 0.0%
- Est. flood insurance / yr
- $507 – $1,088
Fire risk 7/10 · Major
- Est. fire insurance / yr
- $659 – $1,223
Heat risk 3/10 · Minor
- Hot days now (above 92°F)
- 7 days/yr
- Hot days in 30 yrs
- 15 days/yr
Wind risk 1/10 · Minimal
- Chance of severe wind over 30 yrs
- —
Air-quality risk 10/10 · Severe
- Unhealthy air days now
- 25 days/yr
- Unhealthy air days in 30 yrs
- 27 days/yr
Risk factors via First Street. Map © Google.
Why this score? — see what drove the D+ grade
The composite is a weighted blend of 9 inputs, each scored 0–100. Each bar is that input's sub-score; the figure is the points it added to the 100-point composite (weight × sub-score).
- Cash flow +15.3/30.0
- ARV discount +12.1/15.0
- DSCR +4.7/10.0
- Schools +4.6/10.0
- 1% rule +3.2/10.0
- Livability +3.0/5.0
- Rent growth +2.5/5.0
- Condition / age +2.5/5.0
- Appreciation +0.0/10.0
$259,000
🖨 Deal sheet (PDF) 📄 Offer letter ✓ Due diligence
Listing remarks
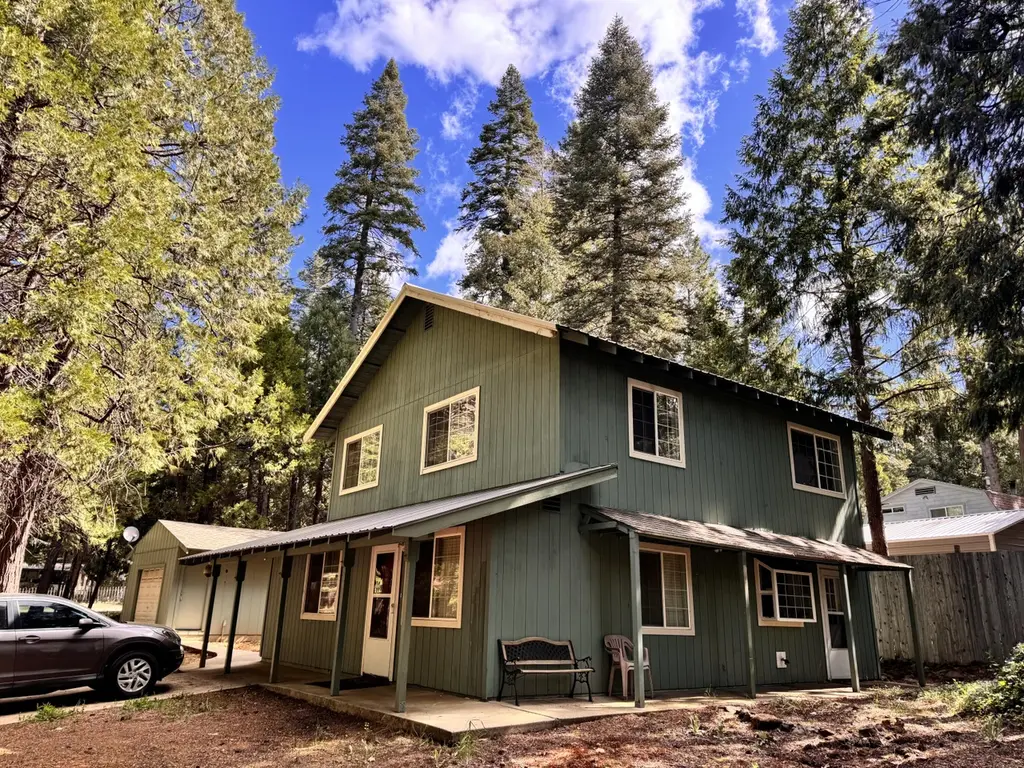
Nestled among the pines in the peaceful mountain community of Shingletown, this spacious 3-bedroom, 2-bath home offers over 1,500 square feet of comfortable living surrounded by nature. Set in a serene wooded setting, the property provides the perfect blend of privacy, tranquility, and everyday convenience. Enjoy the beauty of mountain living while being just approximately five miles from local shopping, dining, and amenities, with Redding only a little over 30 minutes away for an easy commute or access to city conveniences. Whether you're looking for a full-time residence, mountain retreat, or place to unwind among the trees, this inviting home offers space, charm, and the peaceful lifesty
Key facts
- Privacy
- Mountain community
- Tranquility
Tags
Property features AI
Exterior
- Parking: 1-car garage
- Utilities: Public water; Septic tank sewer; 220-volt electric
- Home design: Single family residence; Two levels
- Construction: Wood siding; Slab foundation; Built as residential single family
- Exterior features: Metal roof; Level lot; Asphalt road access; Outbuilding; Has a view
Interior
- Kitchen: Dishwasher; Refrigerator
- Flooring: Laminate
- Bathrooms: 2 full bathrooms
- Heating & cooling: Forced air heating; No cooling
- Interior features: Dishwasher; Dryer; Refrigerator; Washer; Laminate flooring; No fireplace
- Laundry & utility: Washer; Dryer
Neighborhood map
What this means for you Summary
Snapshot
- This is a 3-bed/2.0-bath single-family listed at $259k.
Deal economics
- At list price, monthly cash flow is $95 ($1k/yr) — positive.
- The deal already cash-flows at list — no discount required.
- To meet the 1% rule (rent ≥ 1% of price), the offer needs to be $211k (18.4% below list).
- Recommended offer: $211k (18.4% below list) — sets the bar for 1% rule.
- Cap rate 6.7% vs local median 4.7% in Shingletown — top-decile yield for the area; either an underpriced asset or a hidden risk that comps aren't pricing in. Stress-test before assuming the spread holds.
Location & tenants
- Location reads 59/100 on livability (#663 in CA) — a working-class tenant base; expect higher turnover. Strengths: housing A+, crime B+, health & safety B; Watch: amenities F, commute F, cost of living F.
- Shasta Union High (urban): math 41% / reading 67% proficiency, ranked #122 of 517 in CA (top 24%) — acceptable for families but not a draw, mixed tenant base, ~2y average lease; only 16% free/reduced lunch — higher-income household profile.
- Zoned schools: Black Butte Elementary (149 students, 74% FRL); Black Butte Junior High (75 students, 65% FRL); Foothill High (math 45% / reading 70%, grade C, #232 of 1,170 statewide, top 20%, 1,398 students, 42% FRL) — zoned schools average 61% FRL vs 16% district-wide (45 pts higher); higher-poverty schools than district average — tighter screening recommended.
- Market conditions: 124 active listings in the ZIP; 246 units permitted in Shasta County in 2024 (0 in 5+ unit buildings).
Forward outlook
- Local home prices are declining (-3.0%/yr); year-one equity from $2k of loan paydown is wiped out by about $8k of value loss. Plan a longer hold.
- Shasta County population projected to shrink 9% by 2050 — rents likely to lag national; underwrite the cash flow, not the appreciation.
Negotiation context
- It's been on market 32 days — a 3% lower offer ($251k) is reasonable based on typical stale-listing flexibility.
Risks & watch-outs
- Climate carrying-cost: major wildfire risk — expect insurance premiums to compound above CPI over the hold.
Questions for the listing agent
- It's been on market 32 days. Have you received any prior offers? Is the seller open to a 18% concession, seller financing, or rate buy-down credit?
- Is there a deadline driving the sale (1031 exchange, divorce, estate, relocation)? That informs how much negotiation room exists.
- Schools are F-rated, which usually means shorter tenancies and higher turnover. Who's the typical renter profile here, and what's been the actual vacancy rate?
- The area grade is low — what's the realistic commute time and amenity access for the typical tenant pool here? Any planned neighborhood developments (good or bad) we should know about?
- What's the average days-on-market for RENTAL listings here right now (not sales)? A rising rental-DOM trend means longer vacancies and softer asking-rent achievability than the comps imply.
- What's the recent tenant-quality profile in this submarket — average credit score on applications, eviction rate, late-payment / NSF rate, and stable-employment percentage? A property-management company in the area should have these aggregated.
- How much new for-sale + rental construction is in the pipeline within 1–3 miles? Heavy new supply typically softens prices + rents 12–24 months out; constrained supply supports both.
Investment metrics
- 1% rule
- 0.82% ✗
- Cap rate
- 6.73%
- Cash-on-cash
- 1.58%
- DSCR
- 1.07
- GRM
- 10.2
CMA / ARV
- ARV (on-the-fly)
- $288,512
- Comps found
- 2
Show comp detail 2 sales within ~0.75 mi
| Address | Dist | Beds/Ba | Sqft | Sold | Price | $/sf | Match |
|---|---|---|---|---|---|---|---|
| 8118 Pine Forest Rd | 0.23mi | 3/2.5 | 1,650 (+5%) | 22mo | $302,975 | $184 | 60 |
| 8162 Star Trek Dr | 0.31mi | 2/2.0 (-1) | 1,413 (-10%) | 23mo | $232,000 | $164 | 45 |
Match score weights: distance 35% · size 25% · config 20% · recency 20%. Top-matched comps best support the ARV.
Projected returns pro-forma
-3.0% appreciation · 3.0% rent growth · sell at horizon
- IRR
- -13.8%
- Equity multiple
- 0.50×
- Total profit
- $-35,994
- Equity at exit
- $38,618
- IRR
- -5.1%
- Equity multiple
- 0.67×
- Total profit
- $-23,927
- Equity at exit
- $22,394
Cash invested: $72,520 (down + closing). Projections, not guarantees.
Landlord ↔ Tenant lean methodology
- Overall (STATE)
- 18 Strongly Tenant-Friendly
- State California
- 18 Strongly Tenant-Friendly · D+13
- County
- — inherits STATE
- City
- — inherits STATE
ZIP-level market 96088
- Active inventory
- 124
- Price-to-rent
- 10.2×
Monthly cashflow live
- Estimated rent
- $2,114 medium interval (Pro) →
- Mortgage (P&I)
- −$1,358
- Tax from tax record
- −$109 /mo · $1,306/yr
- Insurance
- −$108
- HOA
- −$0
- Vacancy / Maint / Mgmt
- −$444
- Net cashflow
- $95
Break-even live
Sensitivity live
| Price | -10% $242 | -5% $169 | +0% $95 | +5% $22 | +10% $-51 |
|---|---|---|---|---|---|
| Rent | -10% $-72 | -5% $12 | +0% $95 | +5% $179 | +10% $262 |
| Rate | -1.0pp $226 | -0.5pp $161 | base $95 | +0.5pp $28 | +1.0pp $-40 |
UW: 25.0% down · 7.5% · 30yr · 1.5% tax · 5.0% vac · 8.0% maint · 8.0% mgmt
Financing live
Cash to close
- Down payment
- $64,750
- Closing costs
- $7,770
- Reserves months
- —
- Total cash needed
- —
Loan-product check · same deal, 3 products live
Conventional
25% down · 7.5% · 30yr
- Down + closing
- —
- Monthly P&I
- —
- Monthly cashflow
- —
- DSCR
- —
- Eligible?
- —
Personal DTI + credit; lowest rate.
DSCR
20% down · 8.5% · 30yr
- Down + closing
- —
- Monthly P&I
- —
- Monthly cashflow
- —
- DSCR
- —
- Eligible?
- —
No personal income docs; deal must DSCR.
Hard money
10% down · 12.0% · 12mo
- Down + closing
- —
- Monthly P&I
- —
- Monthly cashflow
- —
- DSCR
- —
- Eligible?
- —
Short-term bridge; refi at stabilization.
Listing history 20 events
-
2026-06-21days on market $259,000 Active 32 DOM
-
2026-06-19days on market $259,000 Active 30 DOM
-
2026-06-18pricedays on market $259,000 Active 29 DOM
-
2026-06-17days on market $269,000 Active 28 DOM
-
2026-06-16days on market $269,000 Active 27 DOM
-
2026-06-15days on market $269,000 Active 26 DOM
-
2026-06-14days on market $269,000 Active 24 DOM
-
2026-06-12days on market $269,000 Active 23 DOM
-
2026-06-10days on market $269,000 Active 21 DOM
-
2026-06-09days on market $269,000 Active 20 DOM
-
2026-06-08days on market $269,000 Active 19 DOM
-
2026-06-07days on market $269,000 Active 18 DOM
-
2026-06-03days on market $269,000 Active 14 DOM
-
2026-06-02days on market $269,000 Active 13 DOM
-
2026-06-01days on market $269,000 Active 12 DOM
-
2026-05-31days on market $269,000 Active 11 DOM
-
2026-05-30days on market $269,000 Active 10 DOM
-
2026-05-20$269,000 Active
-
2025-11-07soldstatus $240,000
-
1994-05-04soldstatus $60,000
ⓘ Source: listings_history table (triggers on properties + properties_extension) + one-shot
backfill from property_details.listing_events for pre-trigger history.
Tax reassessment forecast CA · Resets to sale price
- Current annual tax
- $1,306 · $109/mo
- Projected year-2 tax
- $1,968 · $164/mo
- Expected delta
- +$663/yr (+$55/mo · 50.7%)
ⓘ Screening estimate from a state-policy table — verify with the county assessor before closing.
Climate risk First Street
- Flood 1/10 Low FEMA zone X (unshaded) · 0% chance over 30 yrs
- Wildfire 7/10 Severe
- Heat 3/10 Moderate 7 d/yr ≥92°F today · 15 d/yr by 30 yrs out
- Wind 1/10 Low
- Air quality 10/10 Extreme 25 unhealthy d/yr today · 27 by 30 yrs out
Nearby sold comps map
Loading sold comps map…
Walkable amenities ~0.75 mi
Loading nearby amenities…
Taxation est. · year 1
- Rental income
- $25,372
- − Mortgage interest
- −$14,508
- − Property taxes
- −$1,306
- − Insurance
- −$1,295
- − Repairs & maintenance
- −$2,030
- − Management
- −$2,030
- − Depreciation
- −$7,535
- Taxable loss
- −$3,331
- Est. tax savings @ 24.0%
- +$799
- After-tax cash flow
- $1,944/yr
For passive investors: Depreciation is non-cash, so a rental often shows a tax loss while cash-flowing — sheltering income. Rental losses are passive: they offset passive income freely, and up to $25,000/yr can offset ordinary (W-2) income if you actively participate and your MAGI is under $100k (phasing out to $0 by $150k); unused losses carry forward. On sale, claimed depreciation is recaptured at up to 25%, and gains may owe capital-gains tax (a 1031 exchange can defer both). Figures are a year-1 estimate at your 24.0% rate — not tax advice; consult a CPA.
Schools (NCES district)
- District
- Shasta Union High
- NCES district ID
- 0636600
- Math proficiency
- 41% ▲ 3.00%
- Reading proficiency
- 67% ▲ 9.00%
- Median HH income
- $50,080
- Composite
- 46.01/100
- National rank
- #2532
- State rank
- #122 of 517 in CA
Livability — Shingletown
- Score
- 59/100
- State rank
- #663
- US rank
- #20514
Category grades
Schools grade is shown separately in the Schools card above.
Census & demographics
- Census place
- Shingletown, CA
- City population
- 4,552
- Population (ZIP)
- 4,552
Population outlook (Shasta County) Hauer SSP2
- Today (2025)
- 179,231 people
- By 2030
- 176,953 · -1.3%
- By 2040
- 169,982 · -5.2%
- By 2050
- 162,547 · -9.3%
- By 2075
- 145,649 · -18.7%
- By 2100
- 123,025 · -31.4%
Race, ethnicity, and origin ACS 2023
- Neighborhood character
- Predominantly White (82%)
- Race & ethnicity
- White 82% Two or more races 11% Hispanic / Latino 8% Native American 2%
- Hispanic origin (detail)
- Mexican 6% Cuban 1%
- Common ancestry
- Lithuanian 5% Serbian 3% Portuguese 3%
- Foreign-born
- 3% · Canada, China
- Languages at home
- 94% English-only · Spanish 5%
Political lean MEDSL · Shasta
- 2024 margin
- Solid R (+36.5) · D 30.5% · R 67.0% · Other 2.5%
- 2008→2024 swing
- -10.7pp toward R · 2008: -25.8pp · 2024: -36.5pp
- All cycles
- 2024: R+36.5 2020: R+33.1 2016: R+37.4 2012: R+30.3 2008: R+25.8
Not yet ingested
- Civics
- —
Market trends
- HPI YoY
- ▼ -127.35%
- Current HPI
- 141.2725
- Rent YoY
- —
- Metro
- —
- State GDP YoY
- ▲ 3.21%
- F500 in state
- 116
Industry mix (Fortune 500 HQ in CA)
| Industry | F500 HQs | Revenue |
|---|---|---|
| Technology | 27 | $1,492B |
|
||
| Financial Services | 3 | $174B |
|
||
| Retail | 3 | $44B |
|
||
| Insurance | 3 | $26B |
|
||
| Media / Entertainment | 2 | $115B |
|
||
| Pharmaceuticals / Biotech | 2 | $62B |
|
||
Price history
+348.3% since first listed3 events — show timeline
- 2026-05-20 Listed $269,000 SAOR
- 2025-11-07 Sold (Public Records) $240,000 Public Records
- 1994-05-04 Sold (Public Records) $60,000 Public Records
Property tax history
+2.2%/yrLatest (2025): $1,306 · +1.6% YoY. Source: county tax records.
Cash-flow waterfall
monthlySold comps — $/sqft
last 12 mo · ≤1 miLoading sold comps…