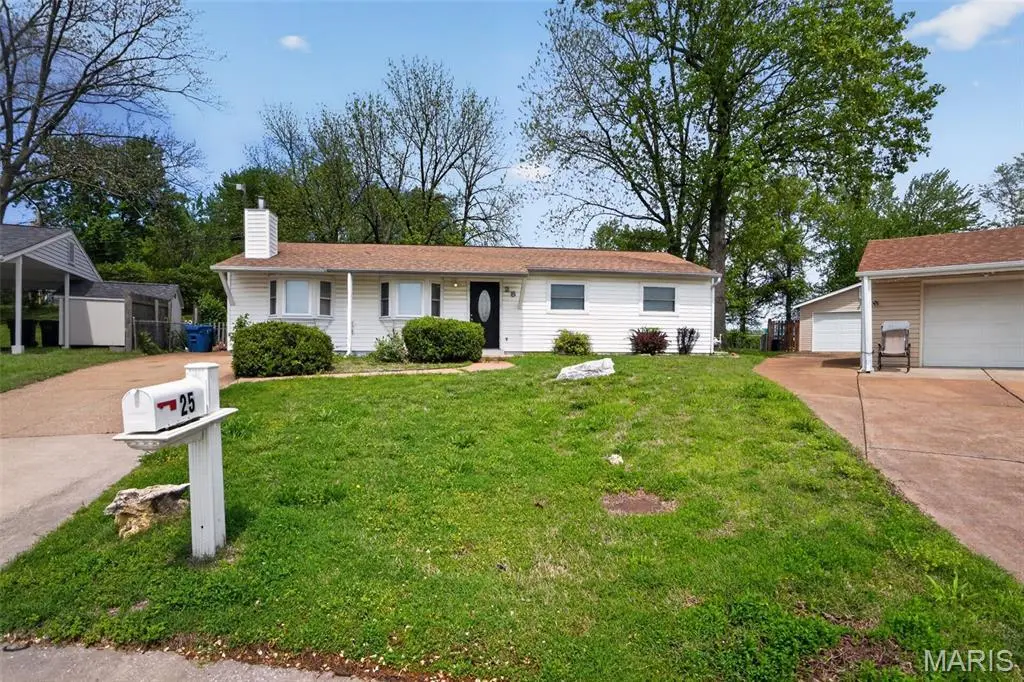
25 Jane Ct
Maryland Heights, MO 63043
$214,900D
3 bd · 1.5 ba ·
1,200 sqft ·
Built 1961
· SingleFamily
· Active
· 60 DOM
Cashflow @ list (25.0% down · 7.5%)
Estimated rent
$1,696/mo
Mortgage (P&I)
−$1,127
Tax + insurance
−$278
HOA
−$0
Vac / Maint / Mgmt
−$356
Net cashflow
$-65/mo
Annual
$-783/yr
Cap rate
5.93%
Cash-on-cash
-1.30%
DSCR
0.94
1% rule
0.79%
Cash to close
$60,172
Investor read
- This is a 3-bed/1.5-bath single-family listed at $215k.
- At list price, monthly cash flow is $-65 ($-783/yr) — negative.
- To cash-flow at today's rent, offer at most $203k (5.4% below list).
- To meet the 1% rule (rent ≥ 1% of price), the offer needs to be $170k (21.1% below list).
- It's been on market 60 days — a 3% lower offer ($208k) is reasonable based on typical stale-listing flexibility.
- Recommended offer: $170k (21.1% below list) — sets the bar for 1% rule.
- Local home prices are declining (-3.0%/yr); year-one equity from $1k of loan paydown is wiped out by about $6k of value loss. Plan a longer hold.
- Location reads 71/100 on livability (#101 in MO) — a middle-class / working-renter tenant base. Strengths: cost of living A+, housing A+, crime A-; Watch: health & safety C-, amenities F, commute F.
- Pattonville R-III (suburban): math 32% / reading 46% proficiency, ranked #147 of 324 in MO (top 45%) — families likely to look elsewhere, expect single-tenant / working-renter base with shorter leases.
- Zoned schools: Parkwood Elem. (math 33% / reading 38%, grade F, #667 of 1,115 statewide, top 60%, 414 students, 46% FRL); Pattonville Sr. High (math 33% / reading 64%, grade D, #147 of 521 statewide, top 29%, 1,893 students, 39% FRL).
- Market conditions: Rents rising (+1.6%/yr); 107 active listings in the ZIP; 6 comparable units currently listed for rent nearby; rentals at typical pace (median 26d on market — plan ~3-4 weeks tenant-placement turnaround); solid renter incomes; 920 units permitted in St. Louis County in 2024 (250 in 5+ unit buildings).
- 5 sale attempts since 12y ago with the ask held roughly flat each time — persistent listings suggest the price (not the market) is what's stuck; bring a comps-based counter.
- Climate carrying-cost: extreme-heat days projected 7→21/yr by 2055 (HVAC capex compounding) — expect insurance premiums to compound above CPI over the hold.
- Cap rate 5.9% vs local median 4.2% in Maryland Heights — top-decile yield for the area; either an underpriced asset or a hidden risk that comps aren't pricing in. Stress-test before assuming the spread holds.
Questions for listing agent
- What do current leases actually rent for vs. the listed asking? Can we see a recent rent roll and the last 12 months of T-12 income?
- It's been on market 60 days. Have you received any prior offers? Is the seller open to a 21% concession, seller financing, or rate buy-down credit?
- Built in 1961 — when were the roof, HVAC, electrical panel, plumbing, and water heater last replaced?
- Is there a deadline driving the sale (1031 exchange, divorce, estate, relocation)? That informs how much negotiation room exists.
- Schools are B-rated — typically a magnet for longer-tenancy family renters. What's the average tenant stay here, and is there a school-zone premium baked into asking?
- The area grade is low — what's the realistic commute time and amenity access for the typical tenant pool here? Any planned neighborhood developments (good or bad) we should know about?
- What's the average days-on-market for RENTAL listings here right now (not sales)? A rising rental-DOM trend means longer vacancies and softer asking-rent achievability than the comps imply.
- What's the recent tenant-quality profile in this submarket — average credit score on applications, eviction rate, late-payment / NSF rate, and stable-employment percentage? A property-management company in the area should have these aggregated.
CashFlowRE · CFR-MQ10ES2RFHM91K
· Data 1 day ago
cashflowre.app · 2026-05-29