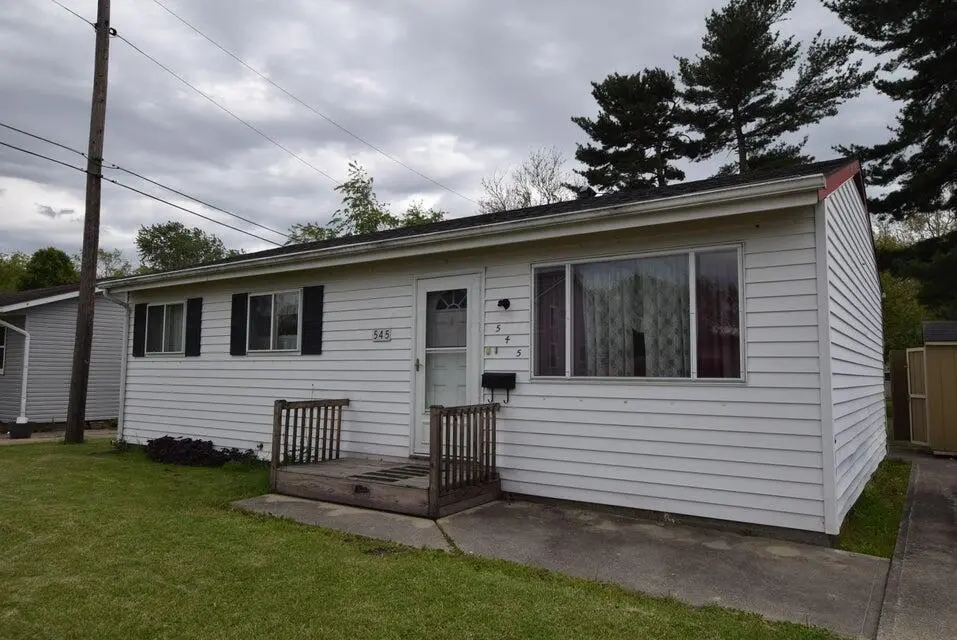
545 W Light St
Urbana, OH 43078
$134,900D+
3 bd · 1.0 ba ·
864 sqft ·
Built 1961
· SingleFamily
· Pending
· 3 DOM
Cashflow @ list (25.0% down · 7.5%)
Estimated rent
$881/mo
Mortgage (P&I)
−$707
Tax + insurance
−$105
HOA
−$0
Vac / Maint / Mgmt
−$185
Net cashflow
$-116/mo
Annual
$-1,394/yr
Cap rate
5.26%
Cash-on-cash
-3.69%
DSCR
0.84
1% rule
0.65%
Cash to close
$37,772
Investor read
- This is a 3-bed/1.0-bath single-family listed at $135k.
- At list price, monthly cash flow is $-116 ($-1k/yr) — negative.
- To cash-flow at today's rent, offer at most $114k (15.2% below list).
- To meet the 1% rule (rent ≥ 1% of price), the offer needs to be $88k (34.7% below list).
- Only 3 days on market — expect competitive offers; lowballing is unlikely to land.
- Recommended offer: $88k (34.7% below list) — sets the bar for 1% rule.
- In year one you build about $14k of equity ($933 loan paydown + $13k appreciation (10.0% local appreciation)).
- Location reads 71/100 on livability (#404 in OH) — a middle-class / working-renter tenant base. Strengths: cost of living A+, housing A+, crime A-; Watch: amenities F, commute F, employment D-.
- Urbana City (town): math 43% / reading 45% proficiency, ranked #509 of 656 in OH (top 78%) — families likely to look elsewhere, expect single-tenant / working-renter base with shorter leases.
- Zoned schools: Urbana Elementary School (math 46% / reading 48%, grade D-, #942 of 1,584 statewide, top 61%, 871 students, 56% FRL); Urbana Junior High School (math 41% / reading 38%, grade F, #519 of 654 statewide, top 80%, 433 students, 50% FRL); Urbana High School (math 42% / reading 57%, grade D, #390 of 781 statewide, top 54%, 550 students, 47% FRL) — zoned schools at 51% FRL track the district average.
- Market conditions: 90 active listings in the ZIP; 4 comparable units currently listed for rent nearby; rentals at typical pace (median 22d on market — plan ~3-4 weeks tenant-placement turnaround); 42 units permitted in Champaign County in 2024 (0 in 5+ unit buildings).
- Champaign County population projected at -25% by 2050 — secular population decline; favor cash flow + early exit over multi-decade hold.
- 3 sale attempts with the ask held roughly flat each time — persistent listings suggest the price (not the market) is what's stuck; bring a comps-based counter.
- By year 3, paydown + projected appreciation supports a ~$37k cash-out refi (75% LTV) — recoverable capital for the next deal without selling this one.
- Cap rate 5.3% vs local median 3.3% in Urbana — top-decile yield for the area; either an underpriced asset or a hidden risk that comps aren't pricing in. Stress-test before assuming the spread holds.
- This rent is only 15% of the median local income ($72k/yr) — well below the 30% rent-burden line; pricing power to push rent on renewal without tenant pushback.
Questions for listing agent
- What do current leases actually rent for vs. the listed asking? Can we see a recent rent roll and the last 12 months of T-12 income?
- Built in 1961 — when were the roof, HVAC, electrical panel, plumbing, and water heater last replaced?
- Is there a deadline driving the sale (1031 exchange, divorce, estate, relocation)? That informs how much negotiation room exists.
- The area grade is low — what's the realistic commute time and amenity access for the typical tenant pool here? Any planned neighborhood developments (good or bad) we should know about?
- What's the average days-on-market for RENTAL listings here right now (not sales)? A rising rental-DOM trend means longer vacancies and softer asking-rent achievability than the comps imply.
- What's the recent tenant-quality profile in this submarket — average credit score on applications, eviction rate, late-payment / NSF rate, and stable-employment percentage? A property-management company in the area should have these aggregated.
- How much new for-sale + rental construction is in the pipeline within 1–3 miles? Heavy new supply typically softens prices + rents 12–24 months out; constrained supply supports both.
CashFlowRE · CFR-MQE7X17CT4CN5S
· Data 4 weeks ago
cashflowre.app · 2026-05-29