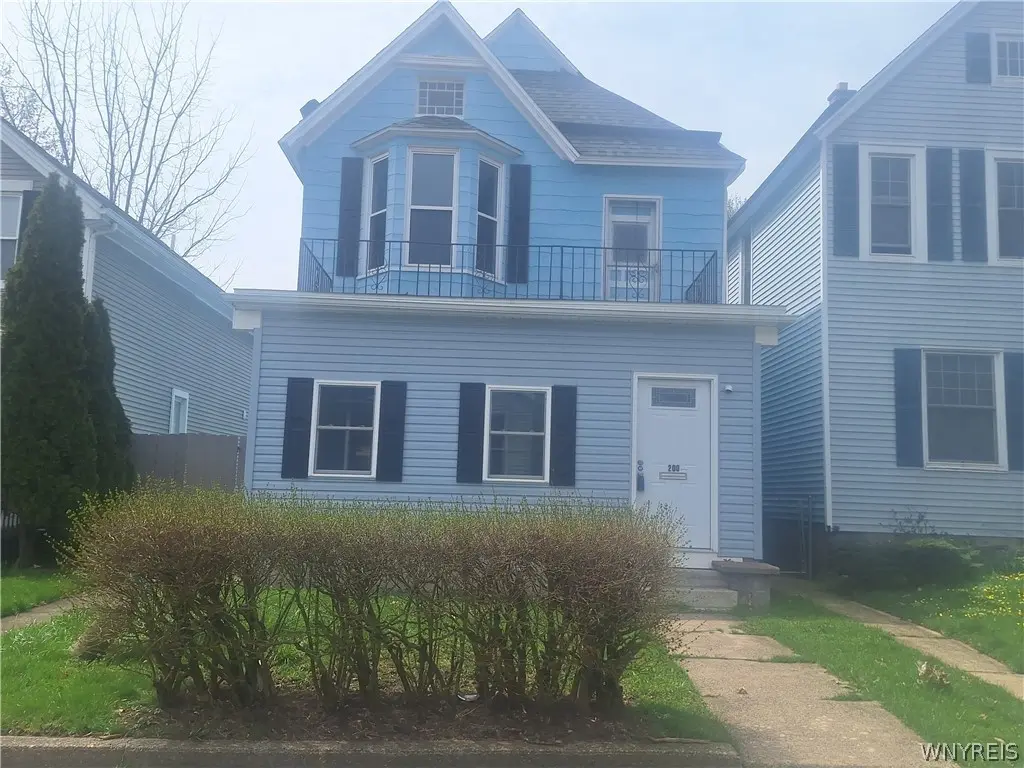
200 W Tupper St
Buffalo, NY 14201
$374,900D
5 bd · 2.0 ba ·
2,096 sqft ·
Built 1850
· MultiFamily
· Pending
· 127 DOM
Cashflow @ list (25.0% down · 7.5%)
Estimated rent
$2,906/mo
Mortgage (P&I)
−$1,966
Tax + insurance
−$625
HOA
−$0
Vac / Maint / Mgmt
−$610
Net cashflow
$-295/mo
Annual
$-3,543/yr
Cap rate
5.35%
Cash-on-cash
-3.37%
DSCR
0.85
1% rule
0.78%
Cash to close
$104,972
Investor read
- This is a 5-bed/2.0-bath multifamily listed at $375k.
- At list price, monthly cash flow is $-295 ($-4k/yr) — negative.
- To cash-flow at today's rent, offer at most $332k (11.4% below list).
- To meet the 1% rule (rent ≥ 1% of price), the offer needs to be $291k (22.5% below list).
- It's been on market 127 days — a 12% lower offer ($330k) is reasonable based on typical stale-listing flexibility.
- Recommended offer: $291k (22.5% below list) — sets the bar for 1% rule.
- Local home prices are declining (-3.0%/yr); year-one equity from $3k of loan paydown is wiped out by about $11k of value loss. Plan a longer hold.
- Location reads 77/100 on livability (#195 in NY, #3,011 nationally) — a middle-class / working-renter tenant base. Strengths: commute A+, housing A+, health & safety A+; Watch: crime F, employment D-.
- Buffalo City School District (urban): math 41% / reading 40% proficiency, ranked #535 of 590 in NY (top 91%) — families likely to look elsewhere, expect single-tenant / working-renter base with shorter leases; 75% free/reduced lunch — lower-income household profile, screen leases tightly.
- Watch-outs: built in 1850 — expect roof / HVAC / electrical / plumbing capex.
- Market conditions: Rents rising fast (+4.3%/yr); 56 active listings in the ZIP; 2 comparable units currently listed for rent nearby; lower-income renter base — watch delinquency; 1,244 units permitted in Erie County in 2024 (563 in 5+ unit buildings).
- 2 sale attempts since 2y ago; this cycle's ask has dropped $50k (12%) from the opening price — seller is motivated, your offer sets the floor, not the list.
- Cap rate 5.3% vs local median 8.0% in Buffalo — below-typical yield; the buyer is paying a premium for something (appreciation thesis, condition, location) that the cap rate doesn't capture.
- At $2,906/mo this rent would consume 86% of the median local household income ($41k/yr) (locally 1213% of renters already pay >50% of income on rent) — very limited rent-growth headroom before tenants either downsize or default.
Questions for listing agent
- What do current leases actually rent for vs. the listed asking? Can we see a recent rent roll and the last 12 months of T-12 income?
- It's been on market 127 days. Have you received any prior offers? Is the seller open to a 22% concession, seller financing, or rate buy-down credit?
- Built in 1850 — when were the roof, HVAC, electrical panel, plumbing, and water heater last replaced?
- Why hasn't it sold? Are there any deal-killer items the seller is aware of (foundation, flood, title, zoning, code violations)?
- Is there a deadline driving the sale (1031 exchange, divorce, estate, relocation)? That informs how much negotiation room exists.
- Crime grade is F in this area — have there been break-ins, vandalism, or insurance claims at this property in the last 3 years? What carrier currently insures it and at what premium?
- The area grade is low — what's the realistic commute time and amenity access for the typical tenant pool here? Any planned neighborhood developments (good or bad) we should know about?
- What's the average days-on-market for RENTAL listings here right now (not sales)? A rising rental-DOM trend means longer vacancies and softer asking-rent achievability than the comps imply.
CashFlowRE · CFR-MQHSDZETF9XQCT
· Data 3 weeks ago
cashflowre.app · 2026-05-29