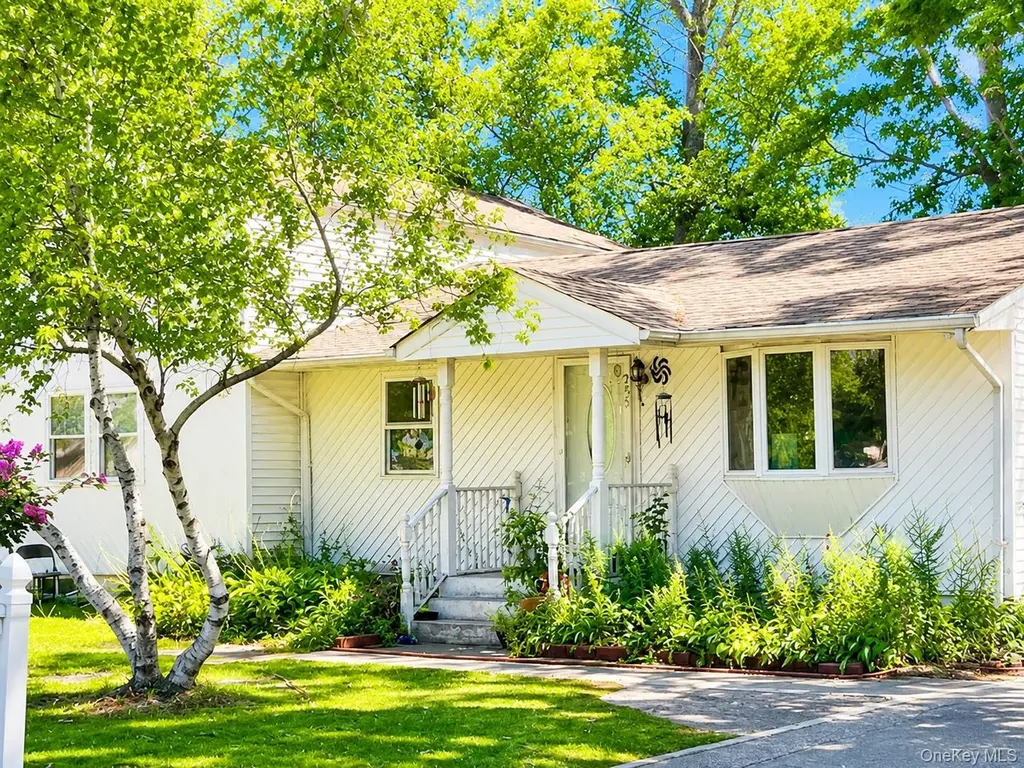
255 Jayne Blvd
Terryville, NY 11776
$399,999C+
4 bd · 4.0 ba ·
1,478 sqft ·
Built 1935
· Other
· Pending
· 7 DOM
Cashflow @ list (25.0% down · 7.5%)
Estimated rent
$4,573/mo
Mortgage (P&I)
−$2,098
Tax + insurance
−$944
HOA
−$0
Vac / Maint / Mgmt
−$960
Net cashflow
$571/mo
Annual
$6,853/yr
Cap rate
8.01%
Cash-on-cash
6.12%
DSCR
1.27
1% rule
1.14%
Cash to close
$112,000
Investor read
- This is a 4-bed/4.0-bath other listed at $400k.
- At list price, monthly cash flow is $571 ($7k/yr) — positive.
- The deal already cash-flows at list — no discount required.
- Meets the 1% rule at list price ($5k rent vs $400k).
- Only 7 days on market — expect competitive offers; lowballing is unlikely to land.
- Local home prices are declining (-3.0%/yr); year-one equity from $3k of loan paydown is wiped out by about $12k of value loss. Plan a longer hold.
- Location reads 67/100 on livability (#589 in NY) — a middle-class / working-renter tenant base. Strengths: employment A+, housing A+, health & safety B; Watch: schools C-, amenities F, commute F.
- Brookhaven-Comsewogue Union Free School District (suburban): math 62% / reading 76% proficiency, ranked #123 of 590 in NY (top 21%) — acceptable for families but not a draw, mixed tenant base, ~2y average lease; only 19% free/reduced lunch — higher-income household profile.
- Watch-outs: built in 1935 — expect roof / HVAC / electrical / plumbing capex.
- Market conditions: Rents flat; 142 active listings in the ZIP; 3 comparable units currently listed for rent nearby; rentals at typical pace (median 16d on market — plan ~3-4 weeks tenant-placement turnaround); high-income renter base; 1,366 units permitted in Suffolk County in 2024 (216 in 5+ unit buildings).
- Suffolk County population projected to shrink 5% by 2050 — rents likely to lag national; underwrite the cash flow, not the appreciation.
- 4 sale attempts since 2y ago; this cycle's ask is 5% above the opening price — seller raised mid-cycle; expect resistance to lowballs.
- Current owner paid $170k; list at $400k implies a 135% gain — meaningful room to come down on a strong offer.
- Climate carrying-cost: major wind risk, 77% chance of damaging wind over 30y; extreme-heat days projected 7→17/yr by 2055 (HVAC capex compounding) — expect insurance premiums to compound above CPI over the hold.
- Cap rate 8.0% vs local median 4.2% in Terryville — top-decile yield for the area; either an underpriced asset or a hidden risk that comps aren't pricing in. Stress-test before assuming the spread holds.
- At $4,573/mo this rent would consume 46% of the median local household income ($121k/yr) (locally 648% of renters already pay >50% of income on rent) — very limited rent-growth headroom before tenants either downsize or default.
Questions for listing agent
- Built in 1935 — when were the roof, HVAC, electrical panel, plumbing, and water heater last replaced?
- Is there a deadline driving the sale (1031 exchange, divorce, estate, relocation)? That informs how much negotiation room exists.
- What's the average days-on-market for RENTAL listings here right now (not sales)? A rising rental-DOM trend means longer vacancies and softer asking-rent achievability than the comps imply.
- What's the recent tenant-quality profile in this submarket — average credit score on applications, eviction rate, late-payment / NSF rate, and stable-employment percentage? A property-management company in the area should have these aggregated.
- How much new for-sale + rental construction is in the pipeline within 1–3 miles? Heavy new supply typically softens prices + rents 12–24 months out; constrained supply supports both.
CashFlowRE · CFR-MS94B101BEG6JY
· Data 1 week ago
cashflowre.app · 2026-05-29