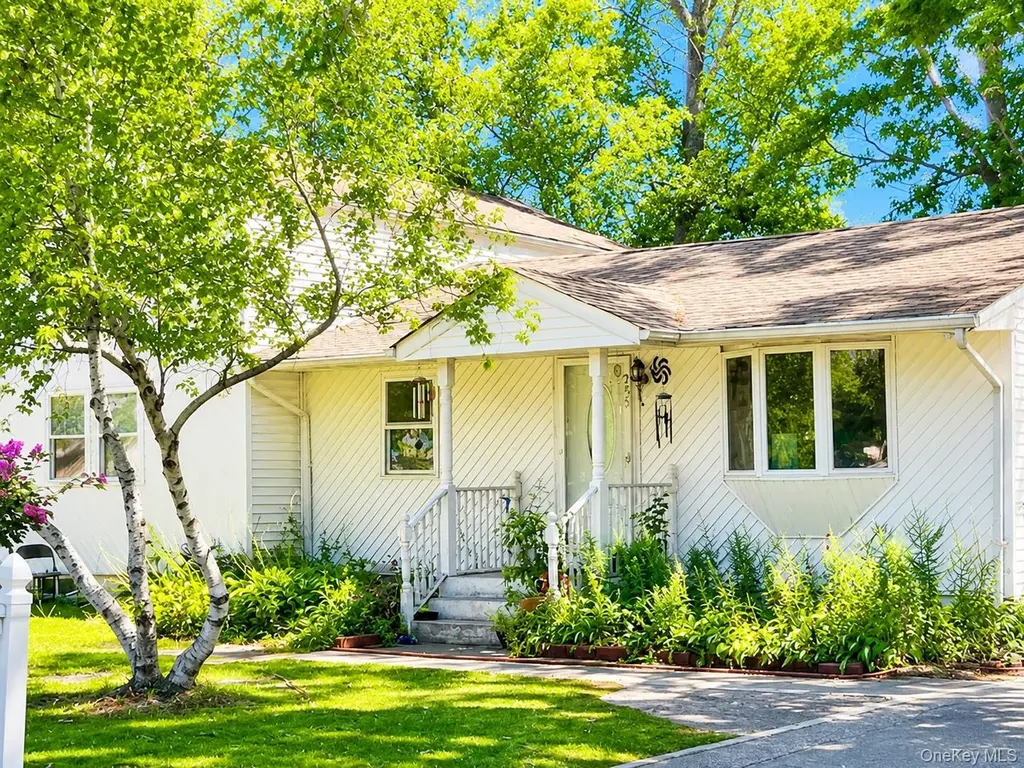
255 Jayne Blvd · Terryville, NY
Flood risk 4/10 · Minor
- FEMA flood zone
- X (unshaded)
- Chance of flooding over 30 yrs
- 0.21%
- Est. flood insurance / yr
- $473 – $860
Fire risk 1/10 · Minimal
- Est. fire insurance / yr
- $691 – $1,283
Heat risk 5/10 · Moderate
- Hot days now (above 95°F)
- 7 days/yr
- Hot days in 30 yrs
- 17 days/yr
Wind risk 6/10 · Moderate
- Chance of severe wind over 30 yrs
- 77.0%
Air-quality risk 4/10 · Minor
- Unhealthy air days now
- 3 days/yr
- Unhealthy air days in 30 yrs
- 5 days/yr
Risk factors via First Street. Map © Google.
Why this score? — see what drove the C+ grade
The composite is a weighted blend of 9 inputs, each scored 0–100. Each bar is that input's sub-score; the figure is the points it added to the 100-point composite (weight × sub-score).
- Cash flow +21.1/30.0
- ARV discount +15.0/15.0
- DSCR +6.7/10.0
- 1% rule +6.4/10.0
- Schools +6.2/10.0
- Livability +3.4/5.0
- Rent growth +2.6/5.0
- Condition / age +2.5/5.0
- Appreciation +0.0/10.0
$399,999
🖨 Deal sheet 📄 Offer letter ✓ Due diligence
Listing remarks MLS
Perfect opportunity to own this 4 Bedroom 4 Bath Cape in Port Jefferson Station. 1 Car Detached Garage. Large Yard, Perfect For Entertaining. Home zoned for Accessory Apartment.
Key facts
- Large yard
- Detached garage
- Accessory apartment
Tags
Neighborhood map
What this means for you Summary
Snapshot
- This is a 4-bed/4.0-bath other listed at $400k.
Deal economics
- At list price, monthly cash flow is $571 ($7k/yr) — positive.
- The deal already cash-flows at list — no discount required.
- Meets the 1% rule at list price ($5k rent vs $400k).
- Cap rate 8.0% vs local median 4.2% in Terryville — top-decile yield for the area; either an underpriced asset or a hidden risk that comps aren't pricing in. Stress-test before assuming the spread holds.
Location & tenants
- Location reads 67/100 on livability (#589 in NY) — a middle-class / working-renter tenant base. Strengths: employment A+, housing A+, health & safety B; Watch: schools C-, amenities F, commute F.
- Brookhaven-Comsewogue Union Free School District (suburban): math 62% / reading 76% proficiency, ranked #123 of 590 in NY (top 21%) — acceptable for families but not a draw, mixed tenant base, ~2y average lease; only 19% free/reduced lunch — higher-income household profile.
- Market conditions: Rents flat; 142 active listings in the ZIP; 3 comparable units currently listed for rent nearby; rentals at typical pace (median 15d on market — plan ~3-4 weeks tenant-placement turnaround); high-income renter base; 1,366 units permitted in Suffolk County in 2024 (216 in 5+ unit buildings).
- At $4,573/mo this rent would consume 46% of the median local household income ($121k/yr) (locally 648% of renters already pay >50% of income on rent) — very limited rent-growth headroom before tenants either downsize or default.
Forward outlook
- Local home prices are declining (-3.0%/yr); year-one equity from $3k of loan paydown is wiped out by about $12k of value loss. Plan a longer hold.
- Suffolk County population projected to shrink 5% by 2050 — rents likely to lag national; underwrite the cash flow, not the appreciation.
Negotiation context
- Only 7 days on market — expect competitive offers; lowballing is unlikely to land.
- 4 sale attempts since 2y ago; this cycle's ask is 5% above the opening price — seller raised mid-cycle; expect resistance to lowballs.
- Current owner paid $170k; list at $400k implies a 135% gain — meaningful room to come down on a strong offer.
Risks & watch-outs
- Watch-outs: built in 1935 — expect roof / HVAC / electrical / plumbing capex.
- Climate carrying-cost: major wind risk, 77% chance of damaging wind over 30y; extreme-heat days projected 7→17/yr by 2055 (HVAC capex compounding) — expect insurance premiums to compound above CPI over the hold.
Questions for the listing agent
- Built in 1935 — when were the roof, HVAC, electrical panel, plumbing, and water heater last replaced?
- Is there a deadline driving the sale (1031 exchange, divorce, estate, relocation)? That informs how much negotiation room exists.
- What's the average days-on-market for RENTAL listings here right now (not sales)? A rising rental-DOM trend means longer vacancies and softer asking-rent achievability than the comps imply.
- What's the recent tenant-quality profile in this submarket — average credit score on applications, eviction rate, late-payment / NSF rate, and stable-employment percentage? A property-management company in the area should have these aggregated.
- How much new for-sale + rental construction is in the pipeline within 1–3 miles? Heavy new supply typically softens prices + rents 12–24 months out; constrained supply supports both.
Investment metrics
- 1% rule
- 1.14% ✓
- Cap rate
- 8.01%
- Cash-on-cash
- 6.12%
- DSCR
- 1.27
- GRM
- 7.3
CMA / ARV
- ARV (median comp)
- $670,755
- List price
- $399,999
- Delta
- -43.35%
- Verdict
- UNDERPRICED
- Comps
- 20 within 1.0 mi
Projected returns pro-forma
-3.0% appreciation · 0.39% rent growth · sell at horizon
- IRR
- -10.0%
- Equity multiple
- 0.64×
- Total profit
- $-39,909
- Equity at exit
- $59,641
- IRR
- -5.1%
- Equity multiple
- 0.71×
- Total profit
- $-32,525
- Equity at exit
- $34,585
Cash invested: $112,000 (down + closing). Projections, not guarantees.
Landlord ↔ Tenant lean methodology
- Overall (STATE)
- 15 Strongly Tenant-Friendly
- State New York
- 15 Strongly Tenant-Friendly · D+10
- County
- — inherits STATE
- City
- — inherits STATE
ZIP-level market 11776
- Rents YoY
- 0.4%
- Active inventory
- 142
- Price-to-rent
- 7.3×
Monthly cashflow live
- Estimated rent
- $4,573 medium interval (Pro) →
- Mortgage (P&I)
- −$2,098
- Tax from tax record
- −$777 /mo · $9,326/yr
- Insurance
- −$167
- HOA
- −$0
- Vacancy / Maint / Mgmt
- −$960
- Net cashflow
- $571
Break-even live
UW: 25.0% down · 7.5% · 30yr · 1.5% tax · 5.0% vac · 8.0% maint · 8.0% mgmt
Financing live
Cash to close
- Down payment
- $100,000
- Closing costs
- $12,000
- Reserves months
- —
- Total cash needed
- —
Loan-product check · same deal, 3 products live
Conventional
25% down · 7.5% · 30yr
- Down + closing
- —
- Monthly P&I
- —
- Monthly cashflow
- —
- DSCR
- —
- Eligible?
- —
Personal DTI + credit; lowest rate.
DSCR
20% down · 8.5% · 30yr
- Down + closing
- —
- Monthly P&I
- —
- Monthly cashflow
- —
- DSCR
- —
- Eligible?
- —
No personal income docs; deal must DSCR.
Hard money
10% down · 12.0% · 12mo
- Down + closing
- —
- Monthly P&I
- —
- Monthly cashflow
- —
- DSCR
- —
- Eligible?
- —
Short-term bridge; refi at stabilization.
Rent comps 3 comps
| Address | Beds | Baths | Sqft | Rent | $/sqft | DOM | Units | Dist |
|---|---|---|---|---|---|---|---|---|
| 364 Broadway Port Jefferson Station, NY | 5.0 | 2.0 | 1582 | $4,500 | $2.84 | 15d | 1 | 0.82mi |
| 34 Village Green Dr Unit 34 Port Jefferson Station, NY | 3.0 | 2.5 | 1871 | $40,000 | $21.38 | 24d | 1 | 1.17mi |
| 303 Arrowhead Ln Centereach, NY | 1.0–3.0 | 1.0–2.0 | 1289 | $4,975 | $3.86 | 1d | 16 | 1.49mi |
Listing history 18 events
-
2026-06-13pricestatusdays on market $399,999 Pending 7 DOM
-
2026-06-09days on market $379,999 Active 27 DOM
-
2026-06-08days on market $379,999 Active 26 DOM
-
2026-06-07days on market $379,999 Active 25 DOM
-
2026-06-04days on market $379,999 Active 22 DOM
-
2026-06-03days on market $379,999 Active 21 DOM
-
2026-06-02days on market $379,999 Active 20 DOM
-
2026-06-01days on market $379,999 Active 19 DOM
-
2026-05-31days on market $379,999 Active 18 DOM
-
2026-05-11$379,999 Active 177-char remark
Show marketing remark (177 chars)
Perfect opportunity to own this 4 Bedroom 4 Bath Cape in Port Jefferson Station. 1 Car Detached Garage. Large Yard, Perfect For Entertaining. Home zoned for Accessory Apartment.
-
2026-03-31status Pending
-
2026-03-31historical
-
2026-03-23$399,999 Active
-
2025-05-09status Active
-
2024-12-05status Pending
-
2024-11-21$399,999 Active
-
2002-01-30soldstatus $170,500
-
1999-07-26soldstatus $100,000
ⓘ Source: listings_history table (triggers on properties + properties_extension) + one-shot
backfill from property_details.listing_events for pre-trigger history.
Tax reassessment forecast NY · Partial reset (capped growth)
- Current annual tax
- $9,326 · $777/mo
- Projected year-2 tax
- $9,326 · $777/mo
- Expected delta
- $0/yr ($0/mo · 0.0%)
ⓘ Screening estimate from a state-policy table — verify with the county assessor before closing.
Climate risk First Street
- Flood 4/10 Moderate FEMA zone X (unshaded) · 21% chance over 30 yrs
- Wildfire 1/10 Low
- Heat 5/10 Major 7 d/yr ≥95°F today · 17 d/yr by 30 yrs out
- Wind 6/10 Major 77% chance of damaging wind over 30 yrs
- Air quality 4/10 Moderate 3 unhealthy d/yr today · 5 by 30 yrs out
Nearby sold comps map
Loading sold comps map…
Walkable amenities ~0.75 mi
Loading nearby amenities…
Taxation est. · year 1
- Rental income
- $54,874
- − Mortgage interest
- −$22,406
- − Property taxes
- −$9,326
- − Insurance
- −$2,000
- − Repairs & maintenance
- −$4,390
- − Management
- −$4,390
- − Depreciation
- −$11,636
- Taxable income
- $726
- Est. tax owed @ 24.0%
- −$174
- After-tax cash flow
- $6,679/yr
For passive investors: Depreciation is non-cash, so a rental often shows a tax loss while cash-flowing — sheltering income. Rental losses are passive: they offset passive income freely, and up to $25,000/yr can offset ordinary (W-2) income if you actively participate and your MAGI is under $100k (phasing out to $0 by $150k); unused losses carry forward. On sale, claimed depreciation is recaptured at up to 25%, and gains may owe capital-gains tax (a 1031 exchange can defer both). Figures are a year-1 estimate at your 24.0% rate — not tax advice; consult a CPA.
Schools (NCES district)
- District
- Brookhaven-Comsewogue Union Free School District
- NCES district ID
- 3615780
- Math proficiency
- 62% ▼ -6.00%
- Reading proficiency
- 76% ▲ 9.00%
- Median HH income
- $84,654
- Composite
- 61.8/100
- National rank
- #733
- State rank
- #123 of 590 in NY
Livability — Terryville
- Score
- 67/100
- State rank
- #589
- US rank
- #10681
Category grades
Schools grade is shown separately in the Schools card above.
Census & demographics
- Census place
- Terryville, NY
- County
- Suffolk County · 679,920 people
- City population
- 23,629
- Metro
- New York-Newark-Jersey City, NY-NJ-PA
- Population (ZIP)
- 22,808
- Household income
- $120,573
- Rent vs Own
- Severe rent burden
- 648.0
Population outlook (Suffolk County) Hauer SSP2
- Today (2025)
- 1,505,262 people
- By 2030
- 1,498,318 · -0.5%
- By 2040
- 1,471,101 · -2.3%
- By 2050
- 1,424,848 · -5.3%
- By 2075
- 1,337,157 · -11.2%
- By 2100
- 1,217,720 · -19.1%
Race, ethnicity, and origin ACS 2023
- Neighborhood character
- Predominantly White (66%)
- Race & ethnicity
- White 66% Hispanic / Latino 25% Two or more races 8% Black 4% Asian 3%
- Hispanic origin (detail)
- Mexican 1% Puerto Rican 4% Dominican 10%
- Common ancestry
- Romanian 5% Scotch-Irish 2% Portuguese 1%
- Foreign-born
- 14% · Canada, Jamaica, South Korea
- Languages at home
- 77% English-only · Spanish 16% Other Indo-European 4% Other Asian/Pacific 1%
Political lean MEDSL · Suffolk
- 2024 margin
- Lean R (+10.0) · D 45.0% · R 55.0%
- 2008→2024 swing
- -16.0pp toward R · 2008: 6.0pp · 2024: -10.0pp
- All cycles
- 2024: R+10.0 2020: R+0.0 2016: R+8.2 2012: D+2.9 2008: D+6.0
Not yet ingested
- Civics
- —
Market trends
- HPI YoY
- ▼ -656.56%
- Current HPI
- 343.598
- Rent YoY
- ▲ 0.39%
- Metro
- New York-Newark-Jersey City, NY-NJ-PA
- State GDP YoY
- ▲ 2.60%
- F500 in state
- 92
Industry mix (Fortune 500 HQ in NY)
| Industry | F500 HQs | Revenue |
|---|---|---|
| Financial Services | 10 | $950B |
|
||
| Consumer Goods | 9 | $162B |
|
||
| Insurance | 4 | $225B |
|
||
| Telecommunications | 2 | $144B |
|
||
| Pharmaceuticals | 2 | $112B |
|
||
| Media / Entertainment | 2 | $69B |
|
||
Price history
+280.0% since first listed9 events — show timeline
- 2026-05-11 Listed $379,999 OneKey® MLS as Distributed by MLS Grid
- 2026-03-31 Pending — OneKey® MLS as Distributed by MLS Grid
- 2026-03-31 Listing Removed — OneKey® MLS as Distributed by MLS Grid
- 2026-03-23 Listed $399,999 OneKey® MLS as Distributed by MLS Grid
- 2025-05-09 Relisted — OneKey® MLS as Distributed by MLS Grid
- 2024-12-05 Pending — OneKey® MLS as Distributed by MLS Grid
- 2024-11-21 Listed $399,999 OneKey® MLS as Distributed by MLS Grid
- 2002-01-30 Sold (Public Records) $170,500 Public Records
- 1999-07-26 Sold (Public Records) $100,000 Public Records
Property tax history
+1.9%/yrLatest (2025): $9,326 · +0.0% YoY. Source: county tax records.
Cash-flow waterfall
monthlySold comps — $/sqft
last 12 mo · ≤1 miLoading sold comps…