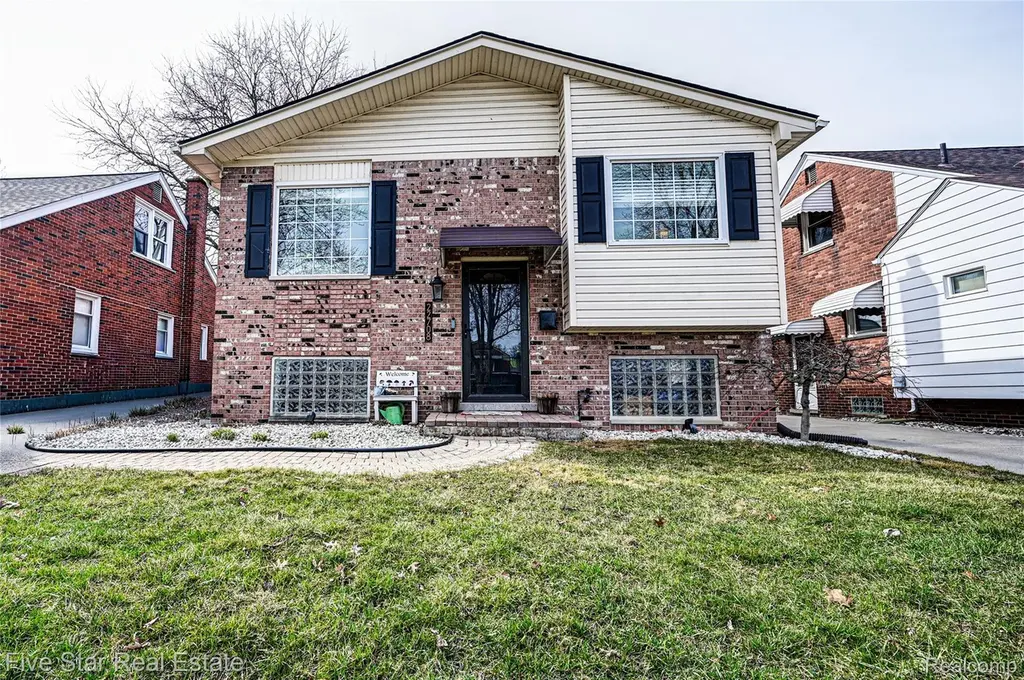
22708 Alger St
St. Clair Shores, MI 48080
$244,900F
3 bd · 1.5 ba ·
1,441 sqft ·
Built 1967
· SingleFamily
· Active
· 83 DOM
Cashflow @ list (25.0% down · 7.5%)
Estimated rent
$1,946/mo
Mortgage (P&I)
−$1,284
Tax + insurance
−$503
HOA
−$0
Vac / Maint / Mgmt
−$409
Net cashflow
$-250/mo
Annual
$-2,997/yr
Cap rate
5.07%
Cash-on-cash
-4.37%
DSCR
0.81
1% rule
0.79%
Cash to close
$68,572
Investor read
- This is a 3-bed/1.5-bath single-family listed at $245k.
- At list price, monthly cash flow is $-250 ($-3k/yr) — negative.
- To cash-flow at today's rent, offer at most $201k (18.0% below list).
- To meet the 1% rule (rent ≥ 1% of price), the offer needs to be $195k (20.6% below list).
- It's been on market 83 days — a 6% lower offer ($230k) is reasonable based on typical stale-listing flexibility.
- Recommended offer: $195k (20.6% below list) — sets the bar for 1% rule.
- Local home prices are declining (-3.0%/yr); year-one equity from $2k of loan paydown is wiped out by about $7k of value loss. Plan a longer hold.
- Location reads: area grade F — affects rentability + tenant quality, not the cash-flow math above.
- South Lake Schools (suburban): math 11% / reading 26% proficiency, ranked #470 of 540 in MI (top 87%) — low school quality limits family demand, transient renter base, plan for 1-2y turnover.
- Market conditions: 161 active listings in the ZIP; 14 comparable units currently listed for rent nearby; rentals leasing fast (median 11d on market — plan ~1-2 weeks tenant-placement turnaround); 43% of comp listings sitting > 30 days — soft ceiling on asking rent; 1,321 units permitted in Macomb County in 2024 (86 in 5+ unit buildings).
- Macomb County population projected at +9% by 2050 — modest demand growth; plan on rents tracking national, not racing it.
- 12 sale attempts since 26y ago with the ask held roughly flat each time — persistent listings suggest the price (not the market) is what's stuck; bring a comps-based counter.
- Current owner paid $200k; 22% above their basis — modest negotiation headroom, anchor on the comps not their cost.
- Cap rate 5.1% vs local median 4.2% in St. Clair Shores — meaningfully above typical; check what's discounted (condition, days-on-market, listing class) to confirm the premium yield is real.
- This rent runs 35% of the median local income ($67k/yr) — at the standard rent-burdened threshold; future hikes will face affordability resistance.
Questions for listing agent
- What do current leases actually rent for vs. the listed asking? Can we see a recent rent roll and the last 12 months of T-12 income?
- It's been on market 83 days. Have you received any prior offers? Is the seller open to a 21% concession, seller financing, or rate buy-down credit?
- Built in 1967 — when were the roof, HVAC, electrical panel, plumbing, and water heater last replaced?
- Why hasn't it sold? Are there any deal-killer items the seller is aware of (foundation, flood, title, zoning, code violations)?
- Is there a deadline driving the sale (1031 exchange, divorce, estate, relocation)? That informs how much negotiation room exists.
- The area grade is low — what's the realistic commute time and amenity access for the typical tenant pool here? Any planned neighborhood developments (good or bad) we should know about?
- What's the average days-on-market for RENTAL listings here right now (not sales)? A rising rental-DOM trend means longer vacancies and softer asking-rent achievability than the comps imply.
- What's the recent tenant-quality profile in this submarket — average credit score on applications, eviction rate, late-payment / NSF rate, and stable-employment percentage? A property-management company in the area should have these aggregated.
CashFlowRE · CFR-MS9C2Y19VFJ8DG
· Data 2 days ago
cashflowre.app · 2026-05-29