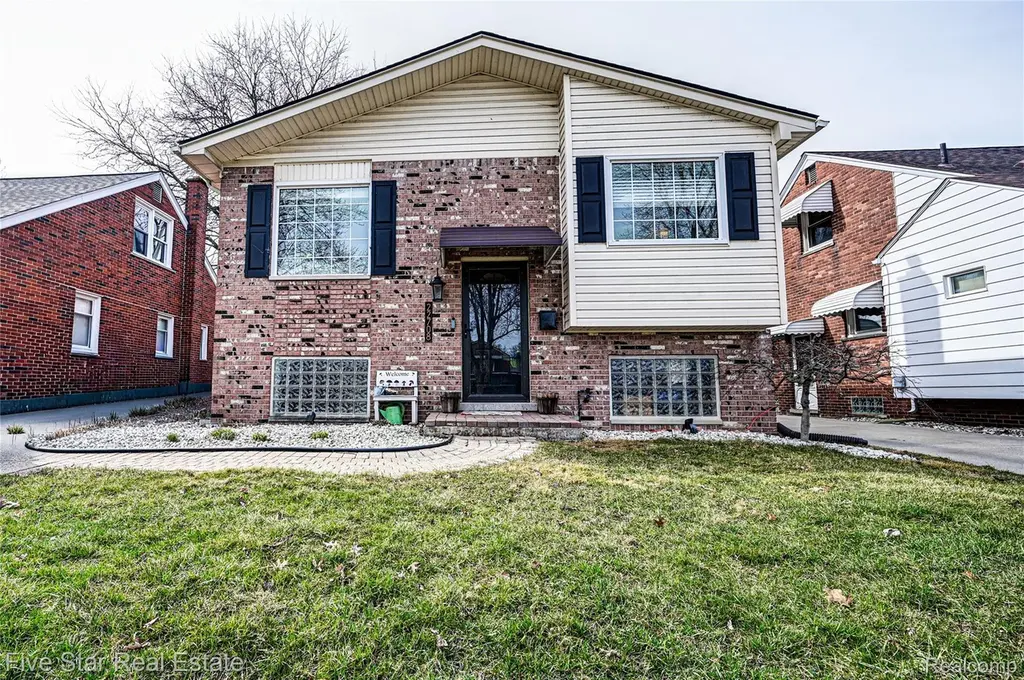
22708 Alger St · St. Clair Shores, MI
Flood risk 1/10 · Minimal
- FEMA flood zone
- X (unshaded)
- Chance of flooding over 30 yrs
- 0.0%
- Est. flood insurance / yr
- $473 – $860
Fire risk 1/10 · Minimal
- Est. fire insurance / yr
- $784 – $1,456
Heat risk 3/10 · Minor
- Hot days now (above 96°F)
- 7 days/yr
- Hot days in 30 yrs
- 15 days/yr
Wind risk 1/10 · Minimal
- Chance of severe wind over 30 yrs
- —
Air-quality risk 4/10 · Minor
- Unhealthy air days now
- 4 days/yr
- Unhealthy air days in 30 yrs
- 5 days/yr
Risk factors via First Street. Map © Google.
Why this score? — see what drove the F grade
The composite is a weighted blend of 9 inputs, each scored 0–100. Each bar is that input's sub-score; the figure is the points it added to the 100-point composite (weight × sub-score).
- ARV discount +9.3/15.0
- Cash flow +8.0/30.0
- 1% rule +2.9/10.0
- Rent growth +2.5/5.0
- Livability +2.5/5.0
- Condition / age +2.5/5.0
- DSCR +2.1/10.0
- Schools +1.7/10.0
- Appreciation +0.0/10.0
$244,900
🖨 Deal sheet 📄 Offer letter ✓ Due diligence
Listing remarks MLS
Welcome to this 3 bedroom, 1 1/2 bath split level home in desirable St. Clair Shores. The main level offers a comfortable living room that flows into the kitchen, all appliances included, and breakfast nook, along with two bedrooms and an updated full bath. The lower level provides additional living space with a spacious family room, third bedroom, and convenient half bath, offering flexibility for guests, a home office, or entertaining. Conveniently located near Lake St. Clair, parks, shopping, dining, and major freeways, this home is ideal for buyers looking for both space and functionality. Recent updates include newer LVP flooring, AC (2022), and hot water tank (2023).
Key facts
- Breakfast nook
- Updated full bath
- Convenient half bath
Tags
Neighborhood map
What this means for you Summary
Snapshot
- This is a 3-bed/1.5-bath single-family listed at $245k.
Deal economics
- At list price, monthly cash flow is $-250 ($-3k/yr) — negative.
- To cash-flow at today's rent, offer at most $201k (18.0% below list).
- To meet the 1% rule (rent ≥ 1% of price), the offer needs to be $195k (20.6% below list).
- Recommended offer: $195k (20.6% below list) — sets the bar for 1% rule.
- Cap rate 5.1% vs local median 4.2% in St. Clair Shores — meaningfully above typical; check what's discounted (condition, days-on-market, listing class) to confirm the premium yield is real.
Location & tenants
- Location reads: area grade F — affects rentability + tenant quality, not the cash-flow math above.
- South Lake Schools (suburban): math 11% / reading 26% proficiency, ranked #470 of 540 in MI (top 87%) — low school quality limits family demand, transient renter base, plan for 1-2y turnover.
- Market conditions: 161 active listings in the ZIP; 14 comparable units currently listed for rent nearby; rentals leasing fast (median 11d on market — plan ~1-2 weeks tenant-placement turnaround); 43% of comp listings sitting > 30 days — soft ceiling on asking rent; 1,321 units permitted in Macomb County in 2024 (86 in 5+ unit buildings).
- This rent runs 35% of the median local income ($67k/yr) — at the standard rent-burdened threshold; future hikes will face affordability resistance.
Forward outlook
- Local home prices are declining (-3.0%/yr); year-one equity from $2k of loan paydown is wiped out by about $7k of value loss. Plan a longer hold.
- Macomb County population projected at +9% by 2050 — modest demand growth; plan on rents tracking national, not racing it.
Negotiation context
- It's been on market 83 days — a 6% lower offer ($230k) is reasonable based on typical stale-listing flexibility.
- 12 sale attempts since 26y ago with the ask held roughly flat each time — persistent listings suggest the price (not the market) is what's stuck; bring a comps-based counter.
- Current owner paid $200k; 22% above their basis — modest negotiation headroom, anchor on the comps not their cost.
Questions for the listing agent
- What do current leases actually rent for vs. the listed asking? Can we see a recent rent roll and the last 12 months of T-12 income?
- It's been on market 83 days. Have you received any prior offers? Is the seller open to a 21% concession, seller financing, or rate buy-down credit?
- Built in 1967 — when were the roof, HVAC, electrical panel, plumbing, and water heater last replaced?
- Why hasn't it sold? Are there any deal-killer items the seller is aware of (foundation, flood, title, zoning, code violations)?
- Is there a deadline driving the sale (1031 exchange, divorce, estate, relocation)? That informs how much negotiation room exists.
- The area grade is low — what's the realistic commute time and amenity access for the typical tenant pool here? Any planned neighborhood developments (good or bad) we should know about?
- What's the average days-on-market for RENTAL listings here right now (not sales)? A rising rental-DOM trend means longer vacancies and softer asking-rent achievability than the comps imply.
- What's the recent tenant-quality profile in this submarket — average credit score on applications, eviction rate, late-payment / NSF rate, and stable-employment percentage? A property-management company in the area should have these aggregated.
- How much new for-sale + rental construction is in the pipeline within 1–3 miles? Heavy new supply typically softens prices + rents 12–24 months out; constrained supply supports both.
Investment metrics
- 1% rule
- 0.79% ✗
- Cap rate
- 5.07%
- Cash-on-cash
- -4.37%
- DSCR
- 0.81
- GRM
- 10.5
CMA / ARV
- ARV (median comp)
- $254,922
- List price
- $244,900
- Delta
- -3.93%
- Verdict
- FAIR
- Comps
- 20 within 1.0 mi
Show comp detail 12 sales within ~0.75 mi
| Address | Dist | Beds/Ba | Sqft | Sold | Price | $/sf | Match |
|---|---|---|---|---|---|---|---|
| 23021 California St | 0.31mi | 3/1.5 | 1,500 (+4%) | 2mo | $245,000 | $163 | 77 |
| 22133 Rosedale St | 0.39mi | 3/1.5 | 1,556 (+8%) | 1mo | $253,000 | $163 | 68 |
| 22117 Englehardt St | 0.53mi | 2/1.5 (-1) | 1,469 (+2%) | 3mo | $229,900 | $157 | 64 |
| 21819 California St | 0.61mi | 3/1.5 | 1,500 (+4%) | 4mo | $245,000 | $163 | 62 |
| 1741 Brys Dr | 0.56mi | 3/1.5 | 1,550 (+8%) | 2mo | $221,000 | $143 | 59 |
| 23065 Englehardt St | 0.48mi | 3/1.5 | 1,299 (-10%) | 3mo | $255,000 | $196 | 59 |
| 1528 Roslyn Rd | 0.56mi | 4/2.0 (+1) | 1,373 (-5%) | 1mo | $275,000 | $200 | 58 |
| 22050 Mauer St | 0.60mi | 4/2.0 (+1) | 1,500 (+4%) | 1mo | $260,000 | $173 | 57 |
| 1809 Roslyn Rd | 0.64mi | 3/2.0 | 1,363 (-5%) | 3mo | $270,000 | $198 | 57 |
| 22150 Mauer St | 0.55mi | 3/1.5 | 1,229 (-15%) | 0mo | $238,000 | $194 | 49 |
| 1218 Roslyn Rd | 0.64mi | 4/3.0 (+1) | 1,552 (+8%) | 0mo | $325,000 | $209 | 46 |
| 21906 Sunnyside St | 0.59mi | 3/1.0 | 1,241 (-14%) | 3mo | $220,000 | $177 | 44 |
Match score weights: distance 35% · size 25% · config 20% · recency 20%. Top-matched comps best support the ARV.
Projected returns pro-forma
-3.0% appreciation · 3.0% rent growth · sell at horizon
- IRR
- -23.6%
- Equity multiple
- 0.19×
- Total profit
- $-55,506
- Equity at exit
- $36,515
- IRR
- -18.4%
- Equity multiple
- 0.00×
- Total profit
- $-68,464
- Equity at exit
- $21,174
Cash invested: $68,572 (down + closing). Projections, not guarantees.
Landlord ↔ Tenant lean methodology
- Overall (STATE)
- 62 Landlord-Friendly
- State Michigan
- 62 Landlord-Friendly · EVEN
- County
- — inherits STATE
- City
- — inherits STATE
ZIP-level market 48080
- Active inventory
- 161
- Price-to-rent
- 10.5×
Monthly cashflow live
- Estimated rent
- $1,946 high interval (Pro) →
- Mortgage (P&I)
- −$1,284
- Tax from tax record
- −$400 /mo · $4,806/yr
- Insurance
- −$102
- HOA
- −$0
- Vacancy / Maint / Mgmt
- −$409
- Net cashflow
- $-250
Break-even live
UW: 25.0% down · 7.5% · 30yr · 1.5% tax · 5.0% vac · 8.0% maint · 8.0% mgmt
Financing live
Cash to close
- Down payment
- $61,225
- Closing costs
- $7,347
- Reserves months
- —
- Total cash needed
- —
Loan-product check · same deal, 3 products live
Conventional
25% down · 7.5% · 30yr
- Down + closing
- —
- Monthly P&I
- —
- Monthly cashflow
- —
- DSCR
- —
- Eligible?
- —
Personal DTI + credit; lowest rate.
DSCR
20% down · 8.5% · 30yr
- Down + closing
- —
- Monthly P&I
- —
- Monthly cashflow
- —
- DSCR
- —
- Eligible?
- —
No personal income docs; deal must DSCR.
Hard money
10% down · 12.0% · 12mo
- Down + closing
- —
- Monthly P&I
- —
- Monthly cashflow
- —
- DSCR
- —
- Eligible?
- —
Short-term bridge; refi at stabilization.
Rent comps 14 comps
| Address | Beds | Baths | Sqft | Rent | $/sqft | DOM | Units | Dist |
|---|---|---|---|---|---|---|---|---|
| 22126 Alger St Saint Clair Shores, MI | 2.0 | 1.5 | 1060 | $1,750 | $1.65 | 11d | 1 | 0.39mi |
| 22617 Oconnor St Saint Clair Shores, MI | 3.0 | 1.0 | 923 | $2,000 | $2.17 | 1d | 1 | 0.47mi |
| 22411 Oconnor St Saint Clair Shores, MI | 2.0 | 1.0 | 950 | $1,250 | $1.32 | 43d | 1 | 0.52mi |
| 1992 Hawthorne Rd Grosse Pointe Woods, MI | 3.0 | 2.0 | 1071 | $2,100 | $1.96 | 10d | 1 | 0.87mi |
| 1150 Anita Ave Grosse Pointe Woods, MI | 3.0 | 1.5 | 1829 | $2,600 | $1.42 | 43d | 1 | 0.90mi |
| 1150 Anita Ave Grosse Pointe Woods, MI | 3.0 | 1.5 | 1129 | $2,600 | $2.30 | 10d | 1 | 0.90mi |
| 2175 Ridgemont Rd Grosse Pointe Woods, MI | 2.0 | 1.0 | 1100 | $1,300 | $1.18 | 43d | 1 | 0.90mi |
| 20625 Elizabeth St Saint Clair Shores, MI | 3.0 | 2.0 | 1074 | $1,895 | $1.76 | 43d | 1 | 0.93mi |
| 24000 Jefferson Ave Unit 218 St Clair Shores, MI | 2.0 | 2.0 | 1000 | $1,800 | $1.80 | 43d | 1 | 0.98mi |
| 218 Riviera Dr St Clair Shores, MI | 2.0 | 2.0 | 1000 | $1,800 | $1.80 | 43d | 1 | 1.02mi |
| 23124 Grove St Saint Clair Shores, MI | 3.0 | 1.0 | 1129 | $2,000 | $1.77 | 1d | 1 | 1.06mi |
| 401 Northshore Dr St Clair Shores, MI | 2.0 | 1.0–1.5 | 970 | $1,554 | $1.60 | 1d | 4 | 1.19mi |
| 20270 Hollywood St Harper Woods, MI | 3.0 | 1.0 | 1228 | $1,650 | $1.34 | 1d | 1 | 1.38mi |
| 1883 Lochmoor Blvd Grosse Pointe Woods, MI | 3.0 | 2.5 | 1744 | $2,900 | $1.66 | 1d | 1 | 1.41mi |
Listing history 50 events
-
2026-06-18days on market $244,900 Active 83 DOM
-
2026-06-17days on market $244,900 Active 82 DOM
-
2026-06-16days on market $244,900 Active 81 DOM
-
2026-06-15days on market $244,900 Active 80 DOM
-
2026-06-13days on market $244,900 Active 78 DOM
-
2026-06-13days on market $244,900 Active 77 DOM
-
2026-06-09days on market $244,900 Active 74 DOM
-
2026-06-08days on market $244,900 Active 73 DOM
-
2026-06-07days on market $244,900 Active 72 DOM
-
2026-06-04days on market $244,900 Active 69 DOM
-
2026-06-03days on market $244,900 Active 68 DOM
-
2026-06-02days on market $244,900 Active 67 DOM
-
2026-06-01days on market $244,900 Active 66 DOM
-
2026-05-31days on market $244,900 Active 65 DOM
-
2026-04-21price $244,900 681-char remark
Show marketing remark (681 chars)
Welcome to this 3 bedroom, 1 1/2 bath split level home in desirable St. Clair Shores. The main level offers a comfortable living room that flows into the kitchen, all appliances included, and breakfast nook, along with two bedrooms and an updated full bath. The lower level provides additional living space with a spacious family room, third bedroom, and convenient half bath, offering flexibility for guests, a home office, or entertaining. Conveniently located near Lake St. Clair, parks, shopping, dining, and major freeways, this home is ideal for buyers looking for both space and functionality. Recent updates include newer LVP flooring, AC (2022), and hot water tank (2023).
-
2026-04-20price $244,900 681-char remark
Show marketing remark (681 chars)
Welcome to this 3 bedroom, 1 1/2 bath split level home in desirable St. Clair Shores. The main level offers a comfortable living room that flows into the kitchen, all appliances included, and breakfast nook, along with two bedrooms and an updated full bath. The lower level provides additional living space with a spacious family room, third bedroom, and convenient half bath, offering flexibility for guests, a home office, or entertaining. Conveniently located near Lake St. Clair, parks, shopping, dining, and major freeways, this home is ideal for buyers looking for both space and functionality. Recent updates include newer LVP flooring, AC (2022), and hot water tank (2023).
-
2026-03-27$249,900 Active 681-char remark
Show marketing remark (681 chars)
Welcome to this 3 bedroom, 1 1/2 bath split level home in desirable St. Clair Shores. The main level offers a comfortable living room that flows into the kitchen, all appliances included, and breakfast nook, along with two bedrooms and an updated full bath. The lower level provides additional living space with a spacious family room, third bedroom, and convenient half bath, offering flexibility for guests, a home office, or entertaining. Conveniently located near Lake St. Clair, parks, shopping, dining, and major freeways, this home is ideal for buyers looking for both space and functionality. Recent updates include newer LVP flooring, AC (2022), and hot water tank (2023).
-
2022-03-15soldstatus $200,000
-
2022-03-10soldstatus $200,000 Sold
-
2022-03-10soldstatus $200,000 Closed
-
2022-02-14status Pending
-
2022-02-14status Pending
-
2022-02-01status Active
-
2022-02-01status Active
-
2022-01-25status Pending
-
2022-01-25status Pending
-
2022-01-24price $199,900
-
2022-01-24price $199,900
-
2022-01-15$215,000 Active
-
2022-01-15$215,000 Active
-
2022-01-13historical $215,000
-
2022-01-13$215,000 Active
-
2022-01-12historical $215,000
-
2022-01-12historical $215,000
-
2018-08-03soldstatus $130,000
-
2018-07-20soldstatus $130,000 Sold
-
2018-07-20soldstatus $130,000 Closed
-
2018-05-21status Pending
-
2018-05-21status Pending
-
2018-05-13$135,000 Active
-
2018-05-13$135,000 Active
-
2009-02-27historical
-
2009-02-27historical
-
2008-05-13$119,900
-
2008-05-13$119,900
-
2001-01-23soldstatus $130,000
-
2000-12-08soldstatus $130,000
-
2000-11-20historical
-
2000-10-31$133,899
ⓘ Source: listings_history table (triggers on properties + properties_extension) + one-shot
backfill from property_details.listing_events for pre-trigger history.
Tax reassessment forecast MI · Partial reset (capped growth)
- Current annual tax
- $4,806 · $400/mo
- Projected year-2 tax
- $4,806 · $400/mo
- Expected delta
- $0/yr ($0/mo · 0.0%)
ⓘ Screening estimate from a state-policy table — verify with the county assessor before closing.
Climate risk First Street
- Flood 1/10 Low FEMA zone X (unshaded) · 0% chance over 30 yrs
- Wildfire 1/10 Low
- Heat 3/10 Moderate 7 d/yr ≥96°F today · 15 d/yr by 30 yrs out
- Wind 1/10 Low
- Air quality 4/10 Moderate 4 unhealthy d/yr today · 5 by 30 yrs out
Nearby sold comps map
Loading sold comps map…
Walkable amenities ~0.75 mi
Loading nearby amenities…
Taxation est. · year 1
- Rental income
- $23,347
- − Mortgage interest
- −$13,718
- − Property taxes
- −$4,806
- − Insurance
- −$1,224
- − Repairs & maintenance
- −$1,868
- − Management
- −$1,868
- − Depreciation
- −$7,124
- Taxable loss
- −$7,261
- Est. tax savings @ 24.0%
- +$1,743
- After-tax cash flow
- $-1,255/yr
For passive investors: Depreciation is non-cash, so a rental often shows a tax loss while cash-flowing — sheltering income. Rental losses are passive: they offset passive income freely, and up to $25,000/yr can offset ordinary (W-2) income if you actively participate and your MAGI is under $100k (phasing out to $0 by $150k); unused losses carry forward. On sale, claimed depreciation is recaptured at up to 25%, and gains may owe capital-gains tax (a 1031 exchange can defer both). Figures are a year-1 estimate at your 24.0% rate — not tax advice; consult a CPA.
Schools (NCES district)
- District
- South Lake Schools
- NCES district ID
- 2632220
- Math proficiency
- 11% ▼ -10.00%
- Reading proficiency
- 26% ▼ -12.00%
- Median HH income
- $51,594
- Composite
- 16.76/100
- National rank
- #9159
- State rank
- #470 of 540 in MI
Livability — St. Clair Shores
No livability data for this city. (Only ~50 U.S. cities are tracked.)
Census & demographics
- Census place
- St. Clair Shores, MI
- County
- Macomb County · 638,552 people
- City population
- 58,217
- Metro
- Detroit-Warren-Dearborn, MI
- Population (ZIP)
- 21,561
- Household income
- $66,986
- Rent vs Own
- Severe rent burden
- 530.0
Population outlook (Macomb County) Hauer SSP2
- Today (2025)
- 925,296 people
- By 2030
- 948,226 · +2.5%
- By 2040
- 983,961 · +6.3%
- By 2050
- 1,010,200 · +9.2%
- By 2075
- 1,076,222 · +16.3%
- By 2100
- 1,077,065 · +16.4%
Race, ethnicity, and origin ACS 2023
- Neighborhood character
- Predominantly White (83%)
- Race & ethnicity
- White 83% Black 8% Two or more races 6% Hispanic / Latino 4% Asian 2%
- Common ancestry
- Romanian 14% Lithuanian 5% Slovak 2%
- Foreign-born
- 6% · Canada, Jamaica
- Languages at home
- 92% English-only · Other Indo-European 3% Spanish 2% Russian/Polish/Slavic 1%
Political lean MEDSL · Macomb
- 2024 margin
- R (+13.7) · D 42.2% · R 55.9% · Other 1.9%
- 2008→2024 swing
- -22.3pp toward R · 2008: 8.6pp · 2024: -13.7pp
- All cycles
- 2024: R+13.7 2020: R+8.1 2016: R+11.6 2012: D+4.0 2008: D+8.6
Not yet ingested
- Civics
- —
Market trends
- HPI YoY
- ▼ -236.99%
- Current HPI
- 231.507
- Rent YoY
- —
- Metro
- Detroit-Warren-Dearborn, MI
- State GDP YoY
- ▲ 1.37%
- F500 in state
- 28
Industry mix (Fortune 500 HQ in MI)
| Industry | F500 HQs | Revenue |
|---|---|---|
| Automotive Parts | 3 | $48B |
|
||
| Automotive | 2 | $372B |
|
||
| Chemicals | 1 | $45B |
|
||
| Automotive Retail | 1 | $29B |
|
||
| Healthcare / Medical Devices | 1 | $23B |
|
||
| Automotive Technology | 1 | $20B |
|
||
Price history
+249.9% since first listed37 events — show timeline
- 2026-04-21 Price Changed $244,900 MiRealSource-MiMLS
- 2026-04-20 Price Changed $244,900 REALCOMP
- 2026-03-27 Listed $249,900 REALCOMP
- 2026-03-27 Listed $249,900 MiRealSource-MiMLS
- 2022-03-15 Sold (Public Records) $200,000 Public Records
- 2022-03-10 Sold (MLS) $200,000 MiRealSource-MiMLS
- 2022-03-10 Sold (MLS) $200,000 REALCOMP
- 2022-02-14 Pending — MiRealSource-MiMLS
- 2022-02-14 Pending — REALCOMP
- 2022-02-01 Relisted — MiRealSource-MiMLS
- 2022-02-01 Relisted — REALCOMP
- 2022-01-25 Pending — MiRealSource-MiMLS
- 2022-01-25 Pending — REALCOMP
- 2022-01-24 Price Changed $199,900 MiRealSource-MiMLS
- 2022-01-24 Price Changed $199,900 REALCOMP
- 2022-01-15 Listed $215,000 MiRealSource-MiMLS
- 2022-01-15 Listed $215,000 REALCOMP
- 2022-01-13 Coming Soon $215,000 MiRealSource-MiMLS
- 2022-01-13 Listed $215,000 MiRealSource-MiMLS
- 2022-01-12 Coming Soon $215,000 MiRealSource-MiMLS
- 2022-01-12 Coming Soon $215,000 REALCOMP
- 2018-08-03 Sold (Public Records) $130,000 Public Records
- 2018-07-20 Sold (MLS) $130,000 MiRealSource-MiMLS
- 2018-07-20 Sold (MLS) $130,000 REALCOMP
- 2018-05-21 Pending — MiRealSource-MiMLS
- 2018-05-21 Pending — REALCOMP
- 2018-05-13 Listed $135,000 MiRealSource-MiMLS
- 2018-05-13 Listed $135,000 REALCOMP
- 2009-02-27 Listing Removed — REALCOMP
- 2009-02-27 Listing Removed — MiRealSource-MiMLS
- 2008-05-13 Listed $119,900 REALCOMP
- 2008-05-13 Listed $119,900 MiRealSource-MiMLS
- 2001-01-23 Sold (Public Records) $130,000 Public Records
- 2000-12-08 Sold (MLS) $130,000 MiRealSource-MiMLS
- 2000-11-20 Listing Removed — MiRealSource-MiMLS
- 2000-10-31 Listed $133,899 MiRealSource-MiMLS
- 1993-08-10 Sold (Public Records) $70,000 Public Records
Property tax history
+6.3%/yrLatest (2025): $4,806 · +0.3% YoY. Source: county tax records.
Cash-flow waterfall
monthlySold comps — $/sqft
last 12 mo · ≤1 miLoading sold comps…