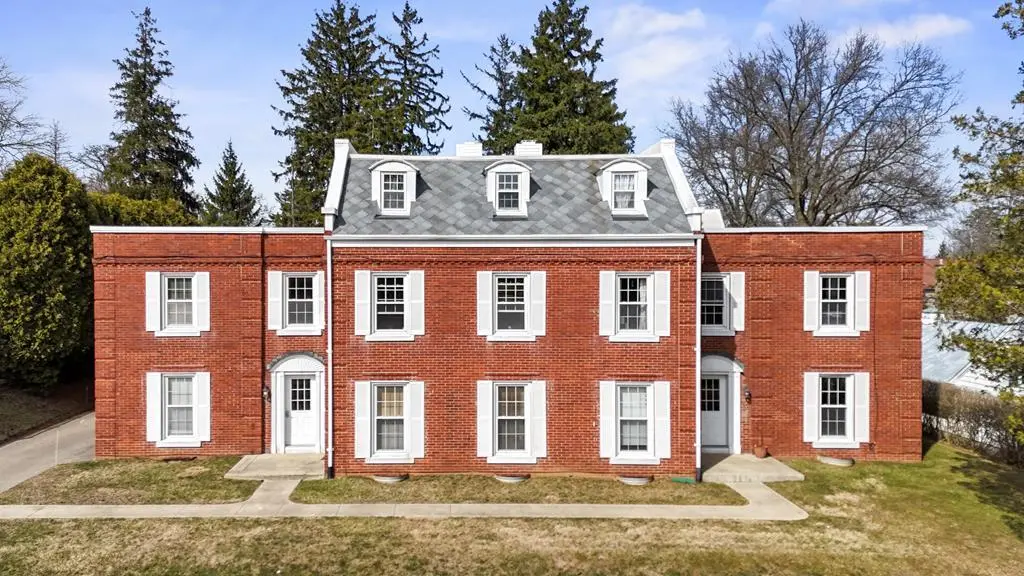
596 Bigelow Rd
Mansfield, OH 44907
$450,000F
2 bd · 1.0 ba ·
8,272 sqft ·
Built 1938
· Townhouse
· Pending
· 10 DOM
Cashflow @ list (25.0% down · 7.5%)
Estimated rent
$1,010/mo
Mortgage (P&I)
−$2,360
Tax + insurance
−$799
HOA
−$0
Vac / Maint / Mgmt
−$212
Net cashflow
$-2,361/mo
Annual
$-28,330/yr
Cap rate
-0.00%
Cash-on-cash
-22.48%
DSCR
-0.00
1% rule
0.22%
Cash to close
$126,000
Investor read
- This is a 2-bed/1.0-bath townhouse listed at $450k.
- At list price, monthly cash flow is $-2k ($-28k/yr) — negative.
- To cash-flow at today's rent, offer at most $116k (74.3% below list).
- To meet the 1% rule (rent ≥ 1% of price), the offer needs to be $101k (77.5% below list).
- Only 10 days on market — expect competitive offers; lowballing is unlikely to land.
- Recommended offer: $101k (77.5% below list) — sets the bar for 1% rule.
- Local home prices are declining (-3.0%/yr); year-one equity from $3k of loan paydown is wiped out by about $14k of value loss. Plan a longer hold.
- Location reads 76/100 on livability (#224 in OH, #3,525 nationally) — a middle-class / working-renter tenant base. Strengths: commute A+, cost of living A+, housing A+; Watch: schools C-, crime D-, amenities D-.
- Mansfield City (urban): math 24% / reading 33% proficiency, ranked #590 of 656 in OH (top 90%) — low school quality limits family demand, transient renter base, plan for 1-2y turnover; 80% free/reduced lunch — lower-income household profile, screen leases tightly.
- Watch-outs: built in 1938 — expect roof / HVAC / electrical / plumbing capex.
- Market conditions: 56 active listings in the ZIP; 145 units permitted in Richland County in 2024 (0 in 5+ unit buildings).
- Richland County population projected at -18% by 2050 — secular population decline; favor cash flow + early exit over multi-decade hold.
- 6 sale attempts since 5y ago with the ask held roughly flat each time — persistent listings suggest the price (not the market) is what's stuck; bring a comps-based counter.
- Current owner paid $315k; 43% above their basis — modest negotiation headroom, anchor on the comps not their cost.
- Cap rate -0.0% vs local median 4.2% in Mansfield — below-typical yield; the buyer is paying a premium for something (appreciation thesis, condition, location) that the cap rate doesn't capture.
Questions for listing agent
- What do current leases actually rent for vs. the listed asking? Can we see a recent rent roll and the last 12 months of T-12 income?
- Built in 1938 — when were the roof, HVAC, electrical panel, plumbing, and water heater last replaced?
- Is there a deadline driving the sale (1031 exchange, divorce, estate, relocation)? That informs how much negotiation room exists.
- Crime grade is D in this area — have there been break-ins, vandalism, or insurance claims at this property in the last 3 years? What carrier currently insures it and at what premium?
- The area grade is low — what's the realistic commute time and amenity access for the typical tenant pool here? Any planned neighborhood developments (good or bad) we should know about?
- What's the average days-on-market for RENTAL listings here right now (not sales)? A rising rental-DOM trend means longer vacancies and softer asking-rent achievability than the comps imply.
- What's the recent tenant-quality profile in this submarket — average credit score on applications, eviction rate, late-payment / NSF rate, and stable-employment percentage? A property-management company in the area should have these aggregated.
- How much new for-sale + rental construction is in the pipeline within 1–3 miles? Heavy new supply typically softens prices + rents 12–24 months out; constrained supply supports both.
CashFlowRE · CFR-MTAX093RSA80P9
· Data 5 days ago
cashflowre.app · 2026-05-29