596 Bigelow Rd · Mansfield, OH
Flood risk 1/10 · Minimal
- FEMA flood zone
- X (unshaded)
- Chance of flooding over 30 yrs
- 0.0%
- Est. flood insurance / yr
- $507 – $1,088
Fire risk 1/10 · Minimal
- Est. fire insurance / yr
- $713 – $1,323
Heat risk 3/10 · Minor
- Hot days now (above 96°F)
- 7 days/yr
- Hot days in 30 yrs
- 17 days/yr
Wind risk 2/10 · Minimal
- Chance of severe wind over 30 yrs
- 0.0%
Air-quality risk 2/10 · Minimal
- Unhealthy air days now
- 1 days/yr
- Unhealthy air days in 30 yrs
- 1 days/yr
Risk factors via First Street. Map © Google.
Why this score? — see what drove the F grade
The composite is a weighted blend of 9 inputs, each scored 0–100. Each bar is that input's sub-score; the figure is the points it added to the 100-point composite (weight × sub-score).
- ARV discount +7.5/15.0
- Livability +3.8/5.0
- Rent growth +2.5/5.0
- Condition / age +2.5/5.0
- Schools +2.3/10.0
- Cash flow +0.0/30.0
- 1% rule +0.0/10.0
- DSCR +0.0/10.0
- Appreciation +0.0/10.0
$450,000
🖨 Deal sheet 📄 Offer letter ✓ Due diligence
Listing remarks MLS
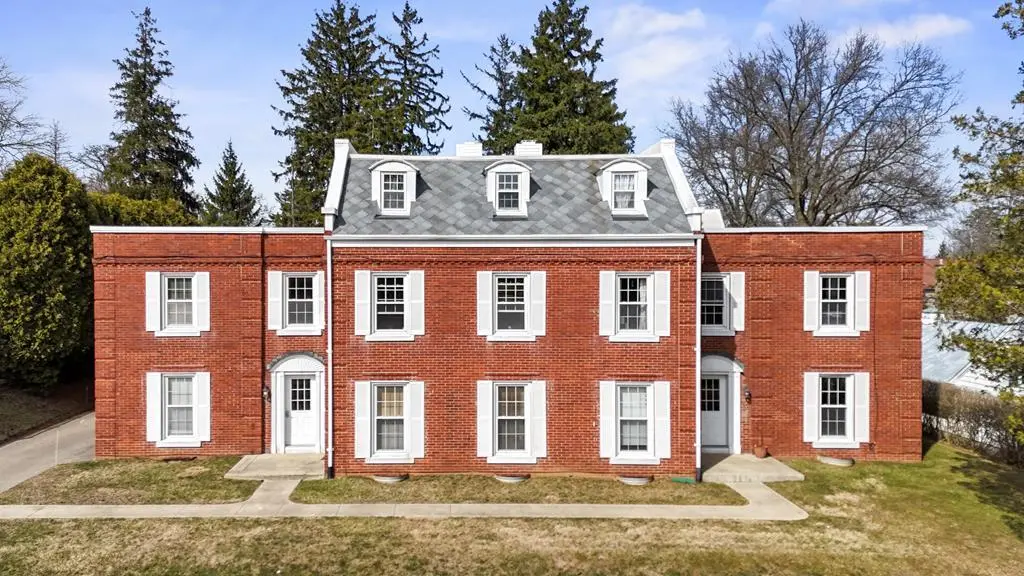
Extremely well maintained brick 7-unit in the heart of Woodland. Built with concrete floors. Updates include boiler, 5 baths, windows, drive, sidewalks, carport flooring, landscaping, water-proofed basement, all roofing, tuck pointing. All halls and common areas in perfect condition. Basement with coin operated washer, dryer. Storage for tenant and carports. Many long-term tenants. Great rental history. Situated in a quiet residential area.
Key facts
- New boiler
- Newer roof
- Woodlawn area
Tags
Property features AI
Finance
- Other: Listing broker: Keller Williams Elevate; Listing agent: Tracy Jones, 419-612-8248
- Financial info: Annual tax: $3,670.68
Exterior
- Home design: Residential income property; Apartment; Commercial subtype listed
- Exterior features: Directions: Get on US-42 S from Claremont Ave; continue on US-42 S to Mansfield; continue on Davis Rd; drive to Bigelow Rd; turn right onto Davis Rd; turn right onto Bigelow Rd; destination will be on the right
Interior
- Heating & cooling: Has heating; Hot Water
- Interior features: Hot water heating
Neighborhood map
What this means for you Summary
Snapshot
- This is a 2-bed/1.0-bath townhouse listed at $450k.
Deal economics
- At list price, monthly cash flow is $-2k ($-28k/yr) — negative.
- To cash-flow at today's rent, offer at most $116k (74.3% below list).
- To meet the 1% rule (rent ≥ 1% of price), the offer needs to be $101k (77.5% below list).
- Recommended offer: $101k (77.5% below list) — sets the bar for 1% rule.
- Cap rate -0.0% vs local median 4.2% in Mansfield — below-typical yield; the buyer is paying a premium for something (appreciation thesis, condition, location) that the cap rate doesn't capture.
Location & tenants
- Location reads 76/100 on livability (#224 in OH, #3,525 nationally) — a middle-class / working-renter tenant base. Strengths: commute A+, cost of living A+, housing A+; Watch: schools C-, crime D-, amenities D-.
- Mansfield City (urban): math 24% / reading 33% proficiency, ranked #590 of 656 in OH (top 90%) — low school quality limits family demand, transient renter base, plan for 1-2y turnover; 80% free/reduced lunch — lower-income household profile, screen leases tightly.
- Market conditions: 56 active listings in the ZIP; 145 units permitted in Richland County in 2024 (0 in 5+ unit buildings).
Forward outlook
- Local home prices are declining (-3.0%/yr); year-one equity from $3k of loan paydown is wiped out by about $14k of value loss. Plan a longer hold.
- Richland County population projected at -18% by 2050 — secular population decline; favor cash flow + early exit over multi-decade hold.
Negotiation context
- Only 10 days on market — expect competitive offers; lowballing is unlikely to land.
- 6 sale attempts since 5y ago with the ask held roughly flat each time — persistent listings suggest the price (not the market) is what's stuck; bring a comps-based counter.
- Current owner paid $315k; 43% above their basis — modest negotiation headroom, anchor on the comps not their cost.
Risks & watch-outs
- Watch-outs: built in 1938 — expect roof / HVAC / electrical / plumbing capex.
Questions for the listing agent
- What do current leases actually rent for vs. the listed asking? Can we see a recent rent roll and the last 12 months of T-12 income?
- Built in 1938 — when were the roof, HVAC, electrical panel, plumbing, and water heater last replaced?
- Is there a deadline driving the sale (1031 exchange, divorce, estate, relocation)? That informs how much negotiation room exists.
- Crime grade is D in this area — have there been break-ins, vandalism, or insurance claims at this property in the last 3 years? What carrier currently insures it and at what premium?
- The area grade is low — what's the realistic commute time and amenity access for the typical tenant pool here? Any planned neighborhood developments (good or bad) we should know about?
- What's the average days-on-market for RENTAL listings here right now (not sales)? A rising rental-DOM trend means longer vacancies and softer asking-rent achievability than the comps imply.
- What's the recent tenant-quality profile in this submarket — average credit score on applications, eviction rate, late-payment / NSF rate, and stable-employment percentage? A property-management company in the area should have these aggregated.
- How much new for-sale + rental construction is in the pipeline within 1–3 miles? Heavy new supply typically softens prices + rents 12–24 months out; constrained supply supports both.
Investment metrics
- 1% rule
- 0.22% ✗
- Cap rate
- -0.00%
- Cash-on-cash
- -22.48%
- DSCR
- -0.00
- GRM
- 37.1
CMA / ARV
No comps found within radius.
Projected returns pro-forma
-3.0% appreciation · 3.0% rent growth · sell at horizon
- IRR
- -64.8%
- Equity multiple
- -0.77×
- Total profit
- $-223,238
- Equity at exit
- $67,096
- IRR
- —
- Equity multiple
- -2.08×
- Total profit
- $-387,825
- Equity at exit
- $38,908
Cash invested: $126,000 (down + closing). Projections, not guarantees.
Landlord ↔ Tenant lean methodology
- Overall (STATE)
- 73 Landlord-Friendly
- State Ohio
- 73 Landlord-Friendly · R+6
- County
- — inherits STATE
- City
- — inherits STATE
ZIP-level market 44907
- Active inventory
- 56
- Price-to-rent
- 37.1×
Monthly cashflow live
- Estimated rent
- $1,010 medium interval (Pro) →
- Mortgage (P&I)
- −$2,360
- Tax from tax record
- −$612 /mo · $7,341/yr
- Insurance
- −$188
- HOA
- −$0
- Vacancy / Maint / Mgmt
- −$212
- Net cashflow
- $-2,361
Break-even live
UW: 25.0% down · 7.5% · 30yr · 1.5% tax · 5.0% vac · 8.0% maint · 8.0% mgmt
Financing live
Cash to close
- Down payment
- $112,500
- Closing costs
- $13,500
- Reserves months
- —
- Total cash needed
- —
Loan-product check · same deal, 3 products live
Conventional
25% down · 7.5% · 30yr
- Down + closing
- —
- Monthly P&I
- —
- Monthly cashflow
- —
- DSCR
- —
- Eligible?
- —
Personal DTI + credit; lowest rate.
DSCR
20% down · 8.5% · 30yr
- Down + closing
- —
- Monthly P&I
- —
- Monthly cashflow
- —
- DSCR
- —
- Eligible?
- —
No personal income docs; deal must DSCR.
Hard money
10% down · 12.0% · 12mo
- Down + closing
- —
- Monthly P&I
- —
- Monthly cashflow
- —
- DSCR
- —
- Eligible?
- —
Short-term bridge; refi at stabilization.
Listing history 8 events
-
2026-06-15statusdays on market $450,000 Pending 10 DOM
-
2026-06-14days on market $450,000 Active 9 DOM
-
2026-06-12days on market $450,000 Active 8 DOM
-
2026-06-09days on market $450,000 Active 5 DOM
-
2026-06-08days on market $450,000 Active 4 DOM
-
2026-06-07days on market $450,000 Active 3 DOM
-
2026-06-05remarks 699-char remark
-
2026-06-05$450,000 Active 1 DOM
ⓘ Source: listings_history table (triggers on properties + properties_extension) + one-shot
backfill from property_details.listing_events for pre-trigger history.
Tax reassessment forecast OH · Partial reset (capped growth)
- Current annual tax
- $7,341 · $612/mo
- Projected year-2 tax
- $7,341 · $612/mo
- Expected delta
- $0/yr ($0/mo · -0.0%)
ⓘ Screening estimate from a state-policy table — verify with the county assessor before closing.
Climate risk First Street
- Flood 1/10 Low FEMA zone X (unshaded) · 0% chance over 30 yrs
- Wildfire 1/10 Low
- Heat 3/10 Moderate 7 d/yr ≥96°F today · 17 d/yr by 30 yrs out
- Wind 2/10 Low 0% chance of damaging wind over 30 yrs
- Air quality 2/10 Low 1 unhealthy d/yr today · 1 by 30 yrs out
Nearby sold comps map
Loading sold comps map…
Walkable amenities ~0.75 mi
Loading nearby amenities…
Taxation est. · year 1
- Rental income
- $12,126
- − Mortgage interest
- −$25,207
- − Property taxes
- −$7,341
- − Insurance
- −$2,250
- − Repairs & maintenance
- −$970
- − Management
- −$970
- − Depreciation
- −$13,091
- Taxable loss
- −$37,704
- Est. tax savings @ 24.0%
- +$9,049
- After-tax cash flow
- $-19,281/yr
For passive investors: Depreciation is non-cash, so a rental often shows a tax loss while cash-flowing — sheltering income. Rental losses are passive: they offset passive income freely, and up to $25,000/yr can offset ordinary (W-2) income if you actively participate and your MAGI is under $100k (phasing out to $0 by $150k); unused losses carry forward. On sale, claimed depreciation is recaptured at up to 25%, and gains may owe capital-gains tax (a 1031 exchange can defer both). Figures are a year-1 estimate at your 24.0% rate — not tax advice; consult a CPA.
Schools (NCES district)
- District
- Mansfield City
- NCES district ID
- 3904429
- Math proficiency
- 24% ▼ -19.00%
- Reading proficiency
- 33% ▼ -12.00%
- Median HH income
- $32,435
- Composite
- 23.25/100
- National rank
- #7934
- State rank
- #590 of 656 in OH
Livability — Mansfield
- Score
- 76/100
- State rank
- #224
- US rank
- #3525
Category grades
Schools grade is shown separately in the Schools card above.
Census & demographics
- Census place
- Mansfield, OH
- County
- Richland County · 43,943 people
- City population
- 16,349
- Metro
- Mansfield, OH
- Population (ZIP)
- 16,349
- Household income
- $48,008
- Rent vs Own
- Severe rent burden
- 637.0
Population outlook (Richland County) Hauer SSP2
- Today (2025)
- 115,577 people
- By 2030
- 111,669 · -3.4%
- By 2040
- 103,323 · -10.6%
- By 2050
- 95,135 · -17.7%
- By 2075
- 76,719 · -33.6%
- By 2100
- 57,188 · -50.5%
Race, ethnicity, and origin ACS 2023
- Neighborhood character
- Predominantly White (76%)
- Race & ethnicity
- White 76% Black 13% Two or more races 8% Hispanic / Latino 2% Asian 1%
- Common ancestry
- Romanian 2% Slovak 2% Italian 2%
- Foreign-born
- 2% · Canada
- Languages at home
- 97% English-only · Spanish 1% Other Indo-European 1% German/W. Germanic 1%
Political lean MEDSL · Richland
- 2024 margin
- Solid R (+42.3) · D 28.4% · R 70.8%
- 2008→2024 swing
- -28.8pp toward R · 2008: -13.6pp · 2024: -42.3pp
- All cycles
- 2024: R+42.3 2020: R+39.7 2016: R+37.5 2012: R+20.1 2008: R+13.6
Not yet ingested
- Civics
- —
Market trends
- HPI YoY
- ▼ -137.54%
- Current HPI
- 239.2549
- Rent YoY
- —
- Metro
- Mansfield, OH
- State GDP YoY
- ▲ 1.98%
- F500 in state
- 48
Industry mix (Fortune 500 HQ in OH)
| Industry | F500 HQs | Revenue |
|---|---|---|
| Insurance | 3 | $145B |
|
||
| Industrial Machinery | 3 | $49B |
|
||
| Financial Services | 3 | $24B |
|
||
| Consumer Goods | 2 | $93B |
|
||
| Aerospace / Defense | 2 | $47B |
|
||
| Utilities | 2 | $33B |
|
||
Price history
+221.4% since first listed16 events — show timeline
- 2026-06-04 Listed $450,000 MARMLS
- 2025-09-11 Price Changed $425,000 MARMLS
- 2025-06-30 Price Changed $449,900 MARMLS
- 2025-04-25 Price Changed $475,000 MARMLS
- 2025-03-17 Listed $499,000 MARMLS
- 2024-04-10 Rental Removed $650 APPFOLIO
- 2024-04-04 Listed for Rent $650 APPFOLIO
- 2024-03-24 Rental Removed $650 APPFOLIO
- 2024-03-13 Listed for Rent $650 APPFOLIO
- 2024-01-07 Rental Removed $650 APPFOLIO
- 2023-12-21 Listed for Rent $650 APPFOLIO
- 2023-07-13 Rental Removed — APPFOLIO
- 2021-03-29 Sold (Public Records) $315,000 Public Records
- 2021-03-26 Sold (MLS) $315,000 MARMLS
- 2021-02-25 Listed $299,900 MARMLS
- 1994-09-30 Sold (Public Records) $140,000 Public Records
Property tax history
+5.5%/yrLatest (2025): $7,341 · +0.3% YoY. Source: county tax records.
Cash-flow waterfall
monthlySold comps — $/sqft
last 12 mo · ≤1 miLoading sold comps…