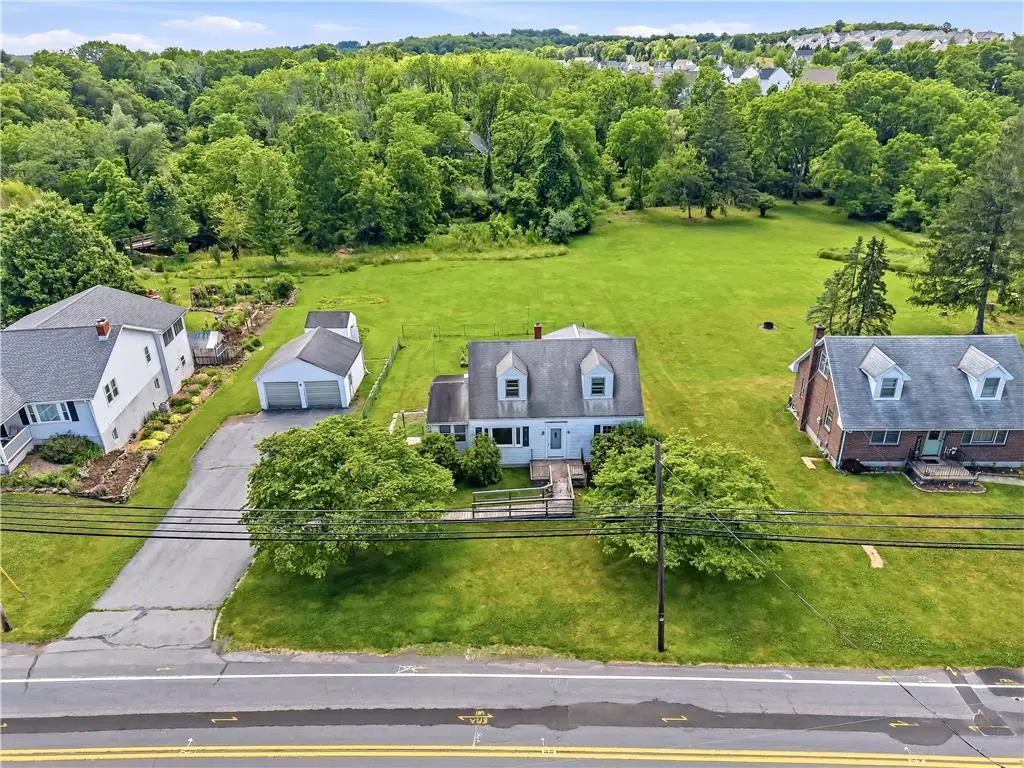
6596 N Main St
Coopersburg, PA 18036
$334,900D
3 bd · 1.5 ba ·
1,536 sqft ·
Built 1953
· SingleFamily
· Active
· 4 DOM
Cashflow @ list (25.0% down · 7.5%)
Estimated rent
$2,759/mo
Mortgage (P&I)
−$1,756
Tax + insurance
−$614
HOA
−$0
Vac / Maint / Mgmt
−$579
Net cashflow
$-191/mo
Annual
$-2,286/yr
Cap rate
5.81%
Cash-on-cash
-1.73%
DSCR
0.92
1% rule
0.82%
Cash to close
$93,772
Investor read
- This is a 3-bed/1.5-bath single-family listed at $335k.
- At list price, monthly cash flow is $-191 ($-2k/yr) — negative.
- To cash-flow at today's rent, offer at most $301k (10.1% below list).
- To meet the 1% rule (rent ≥ 1% of price), the offer needs to be $276k (17.6% below list).
- Only 4 days on market — expect competitive offers; lowballing is unlikely to land.
- Recommended offer: $276k (17.6% below list) — sets the bar for 1% rule.
- Local home prices are declining (-3.0%/yr); year-one equity from $2k of loan paydown is wiped out by about $10k of value loss. Plan a longer hold.
- Location reads 82/100 on livability (#151 in PA, #1,261 nationally) — a professional / high-income tenant draw. Strengths: crime A+, housing A+, health & safety A+; Watch: amenities D, commute F.
- Southern Lehigh SD (suburban): math 60% / reading 76% proficiency, ranked #25 of 539 in PA (top 5%) — acceptable for families but not a draw, mixed tenant base, ~2y average lease; only 10% free/reduced lunch — higher-income household profile.
- Zoned schools: Hopewell El Sch (math 82% / reading 87%, grade A+, #14 of 1,518 statewide, top 2%, 432 students, 10% FRL); Southern Lehigh Intermediate Sch (math 55% / reading 77%, grade A-, #23 of 512 statewide, top 4%, 692 students, 16% FRL); Southern Lehigh Shs (math 77%, 1,056 students, 13% FRL) — zoned schools at 13% FRL track the district average.
- Watch-outs: flood insurance adds $56/mo; built in 1953 — expect roof / HVAC / electrical / plumbing capex.
- Market conditions: 104 active listings in the ZIP; 8 comparable units currently listed for rent nearby; rentals at typical pace (median 22d on market — plan ~3-4 weeks tenant-placement turnaround); high-income renter base; 765 units permitted in Lehigh County in 2024 (286 in 5+ unit buildings).
- Lehigh County population projected at +21% by 2050 — long-run rental-demand tailwind backs the buy-and-hold thesis.
- Climate carrying-cost: severe flood risk; extreme-heat days projected 7→15/yr by 2055 (HVAC capex compounding) — expect insurance premiums to compound above CPI over the hold.
- Cap rate 5.8% vs local median 3.4% in Coopersburg — top-decile yield for the area; either an underpriced asset or a hidden risk that comps aren't pricing in. Stress-test before assuming the spread holds.
Questions for listing agent
- What do current leases actually rent for vs. the listed asking? Can we see a recent rent roll and the last 12 months of T-12 income?
- Built in 1953 — when were the roof, HVAC, electrical panel, plumbing, and water heater last replaced?
- What's the actual annual flood-insurance premium (NFIP or private), and is the property in a SFHA with mandatory coverage?
- Is there a deadline driving the sale (1031 exchange, divorce, estate, relocation)? That informs how much negotiation room exists.
- Schools are B-rated — typically a magnet for longer-tenancy family renters. What's the average tenant stay here, and is there a school-zone premium baked into asking?
- The area grade is low — what's the realistic commute time and amenity access for the typical tenant pool here? Any planned neighborhood developments (good or bad) we should know about?
- What's the average days-on-market for RENTAL listings here right now (not sales)? A rising rental-DOM trend means longer vacancies and softer asking-rent achievability than the comps imply.
- What's the recent tenant-quality profile in this submarket — average credit score on applications, eviction rate, late-payment / NSF rate, and stable-employment percentage? A property-management company in the area should have these aggregated.
CashFlowRE · CFR-MTWRVG730YM0BJ
· Data 4 h ago
cashflowre.app · 2026-05-29