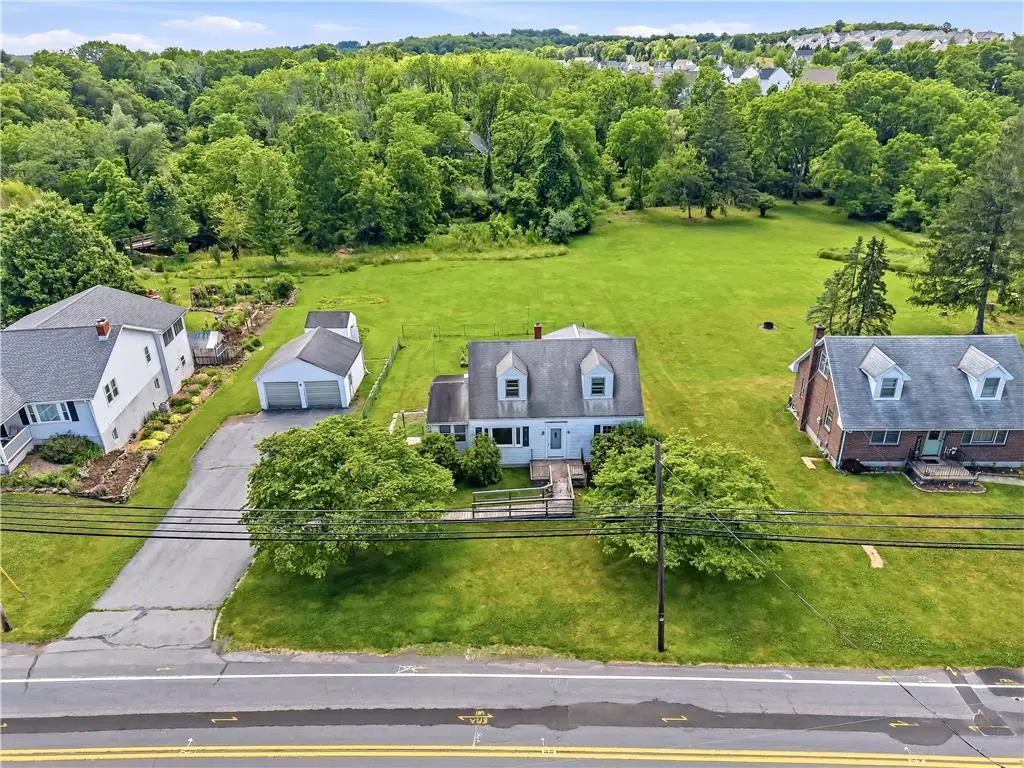
6596 N Main St · Upper Saucon, PA
Flood risk 8/10 · Major
- FEMA flood zone
- X (unshaded)
- Chance of flooding over 30 yrs
- 0.99%
- Est. flood insurance / yr
- $473 – $860
Fire risk 3/10 · Minor
- Est. fire insurance / yr
- $511 – $949
Heat risk 5/10 · Moderate
- Hot days now (above 101°F)
- 7 days/yr
- Hot days in 30 yrs
- 15 days/yr
Wind risk 4/10 · Minor
- Chance of severe wind over 30 yrs
- 17.0%
Air-quality risk 2/10 · Minimal
- Unhealthy air days now
- 1 days/yr
- Unhealthy air days in 30 yrs
- 2 days/yr
Risk factors via First Street. Map © Google.
Why this score? — see what drove the D grade
The composite is a weighted blend of 9 inputs, each scored 0–100. Each bar is that input's sub-score; the figure is the points it added to the 100-point composite (weight × sub-score).
- Cash flow +11.1/30.0
- ARV discount +10.4/15.0
- Schools +6.1/10.0
- 1% rule +3.2/10.0
- DSCR +3.2/10.0
- Rent growth +2.5/5.0
- Livability +2.5/5.0
- Condition / age +2.5/5.0
- Appreciation +0.0/10.0
$334,900
🖨 Deal sheet (PDF) 📄 Offer letter ✓ Due diligence
Listing remarks
Welcome to this charming expanded Cape Cod, situated on nearly one acre in desirable Upper Saucon Township and within the highly regarded Southern Lehigh School District. Offering 3-4 bedrooms and 1.5 baths, this well-maintained home features a traditional floor plan with expanded living spaces, abundant natural light, and intriguing possibilities for future reconfiguration to accommodate a variety of living needs. The original Cape includes a first-floor primary bedroom and full bath, along with two additional bedrooms and a half bath on the second floor. The expanded living area includes a fourth walk-through bedroom leading to a large family room with its own private exterior entrance, c
Key facts
- Large family room
- Expanded cape cod
- Nearly one acre
Tags
Property features AI
Exterior
- Parking: Detached 2-car garage; Driveway parking
- Utilities: 200+ amp electric service with circuit breakers; Well water; Public sewer
- Home design: Single-story home; Above-grade finished living area reported
- Construction: Aluminum and vinyl siding; Asphalt/fiberglass roof
- Exterior features: Sunroom (first floor, 20 x 7); Driveway; Detached garage; Lot roughly 0.956 acre with irregular dimensions 118.5 x 378
Interior
- Kitchen: Kitchen (14 x 11); Refrigerator; Free-standing freezer; Electric water heater
- Bedrooms: First-floor bedroom (11 x 10); First-floor bedroom (12 x 11); First-floor bedroom (14 x 14); Second-floor bedroom (14 x 9.9)
- Flooring: Hardwood; Carpet; Linoleum; Vinyl
- Bathrooms: One full bathroom; One half bathroom (second floor, 7 x 3)
- Heating & cooling: Heat pump heating; Electric heating; Central air conditioning
- Interior features: Eat-in kitchen; Full basement
- Laundry & utility: Washer; Dryer
Neighborhood map
What this means for you Summary
Snapshot
- This is a 3-bed/1.5-bath single-family listed at $335k.
Deal economics
- At list price, monthly cash flow is $-191 ($-2k/yr) — negative.
- To cash-flow at today's rent, offer at most $301k (10.1% below list).
- To meet the 1% rule (rent ≥ 1% of price), the offer needs to be $276k (17.6% below list).
- Recommended offer: $276k (17.6% below list) — sets the bar for 1% rule.
Location & tenants
- Location reads: area grade D — affects rentability + tenant quality, not the cash-flow math above.
- Southern Lehigh SD (suburban): math 60% / reading 76% proficiency, ranked #25 of 539 in PA (top 5%) — acceptable for families but not a draw, mixed tenant base, ~2y average lease; only 10% free/reduced lunch — higher-income household profile.
- Zoned schools: Hopewell El Sch (math 82% / reading 87%, grade A+, #14 of 1,518 statewide, top 2%, 432 students, 10% FRL); Southern Lehigh Intermediate Sch (math 55% / reading 77%, grade A-, #23 of 512 statewide, top 4%, 692 students, 16% FRL); Southern Lehigh Shs (math 77%, 1,056 students, 13% FRL) — zoned schools at 13% FRL track the district average.
- Market conditions: 103 active listings in the ZIP; 8 comparable units currently listed for rent nearby; rentals at typical pace (median 22d on market — plan ~3-4 weeks tenant-placement turnaround); high-income renter base; 765 units permitted in Lehigh County in 2024 (286 in 5+ unit buildings).
Forward outlook
- Local home prices are declining (-3.0%/yr); year-one equity from $2k of loan paydown is wiped out by about $10k of value loss. Plan a longer hold.
- Lehigh County population projected at +21% by 2050 — long-run rental-demand tailwind backs the buy-and-hold thesis.
Negotiation context
- Only 3 days on market — expect competitive offers; lowballing is unlikely to land.
Risks & watch-outs
- Watch-outs: flood insurance adds $56/mo; built in 1953 — expect roof / HVAC / electrical / plumbing capex.
- Climate carrying-cost: severe flood risk; extreme-heat days projected 7→15/yr by 2055 (HVAC capex compounding) — expect insurance premiums to compound above CPI over the hold.
Questions for the listing agent
- What do current leases actually rent for vs. the listed asking? Can we see a recent rent roll and the last 12 months of T-12 income?
- Built in 1953 — when were the roof, HVAC, electrical panel, plumbing, and water heater last replaced?
- What's the actual annual flood-insurance premium (NFIP or private), and is the property in a SFHA with mandatory coverage?
- Is there a deadline driving the sale (1031 exchange, divorce, estate, relocation)? That informs how much negotiation room exists.
- The area grade is low — what's the realistic commute time and amenity access for the typical tenant pool here? Any planned neighborhood developments (good or bad) we should know about?
- What's the average days-on-market for RENTAL listings here right now (not sales)? A rising rental-DOM trend means longer vacancies and softer asking-rent achievability than the comps imply.
- What's the recent tenant-quality profile in this submarket — average credit score on applications, eviction rate, late-payment / NSF rate, and stable-employment percentage? A property-management company in the area should have these aggregated.
- How much new for-sale + rental construction is in the pipeline within 1–3 miles? Heavy new supply typically softens prices + rents 12–24 months out; constrained supply supports both.
Investment metrics
- 1% rule
- 0.82% ✗
- Cap rate
- 5.81%
- Cash-on-cash
- -1.73%
- DSCR
- 0.92
- GRM
- 10.1
CMA / ARV
- ARV (on-the-fly)
- $357,888
- Comps found
- 9
Show comp detail 9 sales within ~0.75 mi
| Address | Dist | Beds/Ba | Sqft | Sold | Price | $/sf | Match |
|---|---|---|---|---|---|---|---|
| 314 Saucon Ln | 0.52mi | 3/1.5 | 1,504 (-2%) | 6mo | $350,100 | $233 | 67 |
| 330 N Main St | 0.49mi | 3/2.0 | 1,481 (-4%) | 9mo | $350,000 | $236 | 62 |
| 6527 Walnut | 0.58mi | 3/1.5 | 1,672 (+9%) | 2mo | $395,000 | $236 | 56 |
| 3526 Flint Hill Rd | 0.48mi | 4/2.0 (+1) | 1,440 (-6%) | 9mo | $410,000 | $285 | 52 |
| 327 N 5th St | 0.51mi | 3/2.0 | 1,416 (-8%) | 19mo | $330,000 | $233 | 45 |
| 4094 Bunker Hill Dr S | 0.53mi | 3/2.5 | 1,730 (+13%) | 10mo | $362,500 | $210 | 42 |
| 657 W Fairmount St | 0.50mi | 3/1.5 | 1,715 (+12%) | 20mo | $378,500 | $221 | 40 |
| 4155 Bunker Hill Dr N | 0.64mi | 3/2.5 | 1,730 (+13%) | 8mo | $355,000 | $205 | 38 |
| 6004 Main St | 0.62mi | 3/1.5 | 1,696 (+10%) | 23mo | $300,000 | $177 | 35 |
Match score weights: distance 35% · size 25% · config 20% · recency 20%. Top-matched comps best support the ARV.
Projected returns pro-forma
-3.0% appreciation · 3.0% rent growth · sell at horizon
- IRR
- -20.3%
- Equity multiple
- 0.29×
- Total profit
- $-66,327
- Equity at exit
- $49,935
- IRR
- -13.4%
- Equity multiple
- 0.22×
- Total profit
- $-73,073
- Equity at exit
- $28,956
Cash invested: $93,772 (down + closing). Projections, not guarantees.
Landlord ↔ Tenant lean methodology
- Overall (STATE)
- 62 Landlord-Friendly
- State Pennsylvania
- 62 Landlord-Friendly · EVEN
- County
- — inherits STATE
- City
- — inherits STATE
ZIP-level market 18036
- Home prices YoY
- -26.5%
- Active inventory
- 103
- Price-to-rent
- 10.1×
Monthly cashflow live
- Estimated rent
- $2,759 high interval (Pro) →
- Mortgage (P&I)
- −$1,756
- Tax from tax record
- −$419 /mo · $5,030/yr
- Insurance
- −$140
- Flood insurance flood zone
- −$56 /mo · $666/yr
- HOA
- −$0
- Lot rent
- −$0
- Vacancy / Maint / Mgmt
- −$579
- Net cashflow
- $-191
Break-even live
Sensitivity live
| Price | -10% $-1 | -5% $-96 | +0% $-191 | +5% $-285 | +10% $-380 |
|---|---|---|---|---|---|
| Rent | -10% $-409 | -5% $-300 | +0% $-191 | +5% $-82 | +10% $27 |
| Rate | -1.0pp $-22 | -0.5pp $-105 | base $-191 | +0.5pp $-277 | +1.0pp $-366 |
UW: 25.0% down · 7.5% · 30yr · 1.5% tax · 5.0% vac · 8.0% maint · 8.0% mgmt
Financing live
Cash to close
- Down payment
- $83,725
- Closing costs
- $10,047
- Reserves months
- —
- Total cash needed
- —
Loan-product check · same deal, 3 products live
Conventional
25% down · 7.5% · 30yr
- Down + closing
- —
- Monthly P&I
- —
- Monthly cashflow
- —
- DSCR
- —
- Eligible?
- —
Personal DTI + credit; lowest rate.
DSCR
20% down · 8.5% · 30yr
- Down + closing
- —
- Monthly P&I
- —
- Monthly cashflow
- —
- DSCR
- —
- Eligible?
- —
No personal income docs; deal must DSCR.
Hard money
10% down · 12.0% · 12mo
- Down + closing
- —
- Monthly P&I
- —
- Monthly cashflow
- —
- DSCR
- —
- Eligible?
- —
Short-term bridge; refi at stabilization.
Rent comps 8 comps
| Address | Beds | Baths | Sqft | Rent | $/sqft | DOM | Units | Dist |
|---|---|---|---|---|---|---|---|---|
| 4144 Bunker Hill Dr S Coopersburg, PA | 3.0 | 2.5 | 2117 | $2,750 | $1.30 | 25d | 1 | 0.59mi |
| 5993 Valley Forge Dr Coopersburg, PA | 3.0 | 2.5 | 1730 | $2,300 | $1.33 | 16d | 1 | 0.61mi |
| 5454 Camp Meeting Rd Center Valley, PA | 3.0 | 1.5 | 1277 | $2,375 | $1.86 | 16d | 1 | 1.21mi |
| 4043 Waterford Dr Unit 1 Center Valley, PA | 3.0 | 2.5 | 2241 | $2,750 | $1.23 | 21d | 1 | 1.33mi |
| 7512 Clayton Ave Coopersburg, PA | 3.0 | 2.5 | 1800 | $2,600 | $1.44 | 20d | 1 | 1.38mi |
| 7620 Clayton Ave Coopersburg, PA | 3.0 | 2.5 | 2040 | $2,650 | $1.30 | 5d | 1 | 1.42mi |
| 7634 Clayton Ave Coopersburg, PA | 3.0 | 2.5 | 1734 | $2,750 | $1.59 | 21d | 1 | 1.44mi |
| 7666 Clayton Ave Coopersburg, PA | 3.0 | 2.5 | 1732 | $2,550 | $1.47 | 46d | 1 | 1.48mi |
Listing history 3 events
-
2026-06-22days on market $334,900 Active 3 DOM
-
2026-06-18remarks 699-char remark
-
2026-06-18$334,900 Active 1 DOM
ⓘ Source: listings_history table (triggers on properties + properties_extension) + one-shot
backfill from property_details.listing_events for pre-trigger history.
Tax reassessment forecast PA · Partial reset (capped growth)
- Current annual tax
- $5,030 · $419/mo
- Projected year-2 tax
- $5,161 · $430/mo
- Expected delta
- +$131/yr (+$11/mo · 2.6%)
ⓘ Screening estimate from a state-policy table — verify with the county assessor before closing.
Climate risk First Street
- Flood 8/10 Severe FEMA zone X (unshaded) · 99% chance over 30 yrs
- Wildfire 3/10 Moderate
- Heat 5/10 Major 7 d/yr ≥101°F today · 15 d/yr by 30 yrs out
- Wind 4/10 Moderate 17% chance of damaging wind over 30 yrs
- Air quality 2/10 Low 1 unhealthy d/yr today · 2 by 30 yrs out
Nearby sold comps map
Loading sold comps map…
Walkable amenities ~0.75 mi
Loading nearby amenities…
Taxation est. · year 1
- Rental income
- $33,114
- − Mortgage interest
- −$18,760
- − Property taxes
- −$5,030
- − Insurance
- −$2,341
- − Repairs & maintenance
- −$2,649
- − Management
- −$2,649
- − Depreciation
- −$9,743
- Taxable loss
- −$8,058
- Est. tax savings @ 24.0%
- +$1,934
- After-tax cash flow
- $-352/yr
For passive investors: Depreciation is non-cash, so a rental often shows a tax loss while cash-flowing — sheltering income. Rental losses are passive: they offset passive income freely, and up to $25,000/yr can offset ordinary (W-2) income if you actively participate and your MAGI is under $100k (phasing out to $0 by $150k); unused losses carry forward. On sale, claimed depreciation is recaptured at up to 25%, and gains may owe capital-gains tax (a 1031 exchange can defer both). Figures are a year-1 estimate at your 24.0% rate — not tax advice; consult a CPA.
Schools (NCES district)
- District
- Southern Lehigh SD
- NCES district ID
- 4222350
- Math proficiency
- 60% ▼ -11.00%
- Reading proficiency
- 76% ▼ -6.00%
- Median HH income
- $82,600
- Composite
- 60.76/100
- National rank
- #823
- State rank
- #25 of 539 in PA
Livability — Upper Saucon
No livability data for this city. (Only ~50 U.S. cities are tracked.)
Census & demographics
- County
- Lehigh County · 333,019 people
- Metro
- Allentown-Bethlehem-Easton, PA-NJ
- Population (ZIP)
- 15,581
- Household income
- $129,123
- Rent vs Own
- Severe rent burden
- 154.0
Population outlook (Lehigh County) Hauer SSP2
- Today (2025)
- 392,957 people
- By 2030
- 408,319 · +3.9%
- By 2040
- 440,007 · +12.0%
- By 2050
- 475,940 · +21.1%
- By 2075
- 590,448 · +50.3%
- By 2100
- 690,314 · +75.7%
Race, ethnicity, and origin ACS 2023
- Neighborhood character
- Predominantly White (87%)
- Race & ethnicity
- White 87% Two or more races 6% Hispanic / Latino 4% Asian 2% Black 1%
- Common ancestry
- Romanian 5% Scotch-Irish 3% Polish 3%
- Foreign-born
- 3% · Canada
- Languages at home
- 95% English-only · Spanish 2% Other Indo-European 1%
Political lean MEDSL · Lehigh
- 2024 margin
- Toss-up / Even · D 50.7% · R 48.0% · Other 1.2%
- 2008→2024 swing
- -12.9pp toward R · 2008: 15.6pp · 2024: 2.7pp
- All cycles
- 2024: D+2.7 2020: D+7.6 2016: D+4.4 2012: D+7.5 2008: D+15.6
Not yet ingested
- Civics
- —
Market trends
- HPI YoY
- ▼ -99.91%
- Current HPI
- 276.798
- Rent YoY
- —
- Metro
- Allentown-Bethlehem-Easton, PA-NJ
- State GDP YoY
- ▲ 1.68%
- F500 in state
- 34
Industry mix (Fortune 500 HQ in PA)
| Industry | F500 HQs | Revenue |
|---|---|---|
| Healthcare | 2 | $309B |
|
||
| Insurance | 2 | $27B |
|
||
| Telecommunications / Media | 1 | $124B |
|
||
| Industrial Distribution | 1 | $22B |
|
||
| Financial Services | 1 | $20B |
|
||
| Chemicals / Materials | 1 | $18B |
|
||
Price history
1 event — show timeline
- 2026-06-18 Listed $334,900 GLVRMLS
Property tax history
+1.1%/yrLatest (2026): $5,030 · +2.0% YoY. Source: county tax records.
Cash-flow waterfall
monthlySold comps — $/sqft
last 12 mo · ≤1 miLoading sold comps…