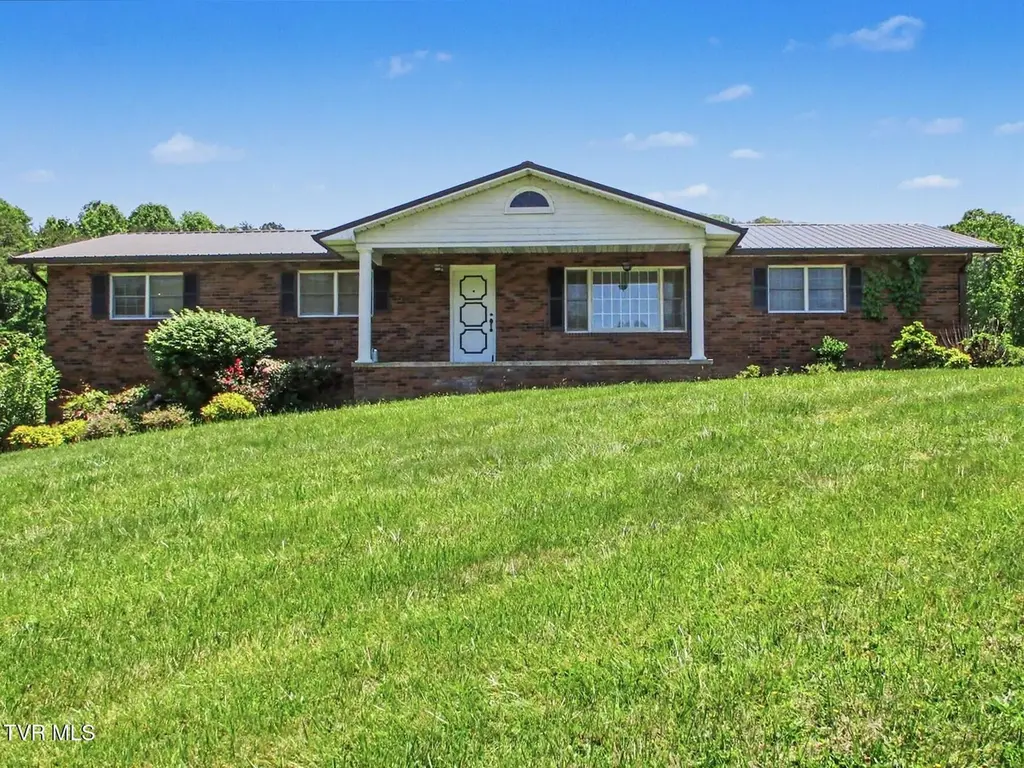
2517 Sinking Creek Rd
Johnson City, TN 37604
$1F
4 bd · 2.0 ba ·
1,914 sqft ·
Built 1976
· SingleFamily
· Active
· 26 DOM
Cashflow @ list (25.0% down · 7.5%)
Estimated rent
$2,060/mo
Mortgage (P&I)
−$1,777
Tax + insurance
−$565
HOA
−$0
Vac / Maint / Mgmt
−$433
Net cashflow
$-714/mo
Annual
$-8,565/yr
Cap rate
3.76%
Cash-on-cash
-9.03%
DSCR
0.60
1% rule
0.61%
Cash to close
$94,858
Investor read
- This is a 4-bed/2.0-bath single-family listed at $1.
- At list price, monthly cash flow is $-714 ($-9k/yr) — negative.
- The deal already cash-flows at list — no discount required.
- Meets the 1% rule at list price ($2k rent vs $1).
- It's been on market 26 days — a 2% lower offer ($0) is reasonable based on typical stale-listing flexibility.
- Local home prices are declining (-3.0%/yr); year-one equity from $2k of loan paydown is wiped out by about $10k of value loss. Plan a longer hold.
- Location reads 76/100 on livability (#8 in TN, #3,349 nationally) — a middle-class / working-renter tenant base. Strengths: amenities A+, cost of living A+, health & safety A; Watch: crime D, commute F, employment F.
- Washington County (suburban): math 26% / reading 34% proficiency, ranked #54 of 139 in TN (top 39%) — families likely to look elsewhere, expect single-tenant / working-renter base with shorter leases.
- Zoned schools: Lamar Elementary (math 16% / reading 23%, grade F, #654 of 952 statewide, top 72%, 421 students, 0% FRL); David Crockett High School (math 25% / reading 39%, grade F, #56 of 332 statewide, top 20%, 1,181 students, 0% FRL) — zoned schools average 0% FRL vs 41% district-wide (41 pts lower); this property's tenant base skews higher-income than the district average.
- Watch-outs: property tax is 508167.0% of price.
- Market conditions: Rents rising (+1.5%/yr); 207 active listings in the ZIP; 3 comparable units currently listed for rent nearby; rentals at typical pace (median 22d on market — plan ~3-4 weeks tenant-placement turnaround); 1,155 units permitted in Washington County in 2024 (437 in 5+ unit buildings).
- Washington County population projected at +9% by 2050 — modest demand growth; plan on rents tracking national, not racing it.
- Climate carrying-cost: moderate wildfire risk — expect insurance premiums to compound above CPI over the hold.
- Cap rate 3.8% vs local median 3.1% in Johnson City — meaningfully above typical; check what's discounted (condition, days-on-market, listing class) to confirm the premium yield is real.
- At $2,060/mo this rent would consume 47% of the median local household income ($52k/yr) (locally 2254% of renters already pay >50% of income on rent) — very limited rent-growth headroom before tenants either downsize or default.
Questions for listing agent
- What do current leases actually rent for vs. the listed asking? Can we see a recent rent roll and the last 12 months of T-12 income?
- Built in 1976 — when were the roof, HVAC, electrical panel, plumbing, and water heater last replaced?
- Property tax is high relative to price — has the assessment been appealed recently, and will the sale trigger a re-assessment?
- Is there a deadline driving the sale (1031 exchange, divorce, estate, relocation)? That informs how much negotiation room exists.
- Crime grade is D in this area — have there been break-ins, vandalism, or insurance claims at this property in the last 3 years? What carrier currently insures it and at what premium?
- The area grade is low — what's the realistic commute time and amenity access for the typical tenant pool here? Any planned neighborhood developments (good or bad) we should know about?
- What's the average days-on-market for RENTAL listings here right now (not sales)? A rising rental-DOM trend means longer vacancies and softer asking-rent achievability than the comps imply.
- What's the recent tenant-quality profile in this submarket — average credit score on applications, eviction rate, late-payment / NSF rate, and stable-employment percentage? A property-management company in the area should have these aggregated.
CashFlowRE · CFR-MV6SCYCE27XZ9H
· Data 1 week ago
cashflowre.app · 2026-05-29