 🔨 Auction
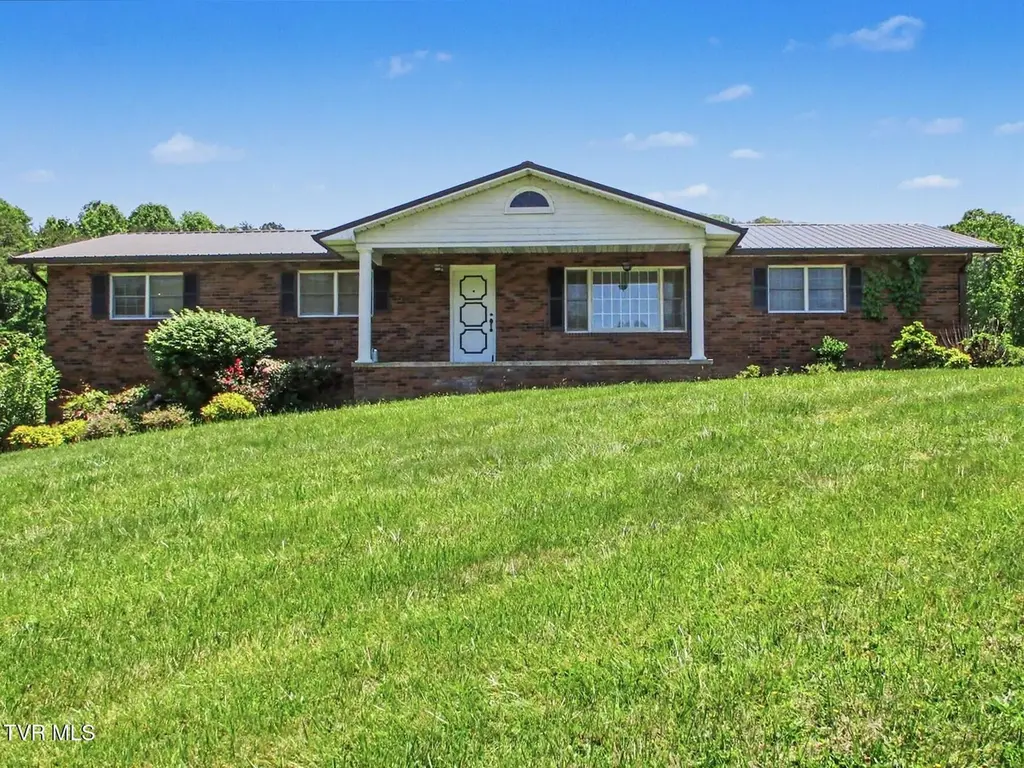
2517 Sinking Creek Rd · Johnson City, TN
Flood risk 1/10 · Minimal
- FEMA flood zone
- X (unshaded)
- Chance of flooding over 30 yrs
- 0.0%
- Est. flood insurance / yr
- $473 – $860
Fire risk 5/10 · Moderate
- Est. fire insurance / yr
- $949 – $1,763
Heat risk 4/10 · Minor
- Hot days now (above 95°F)
- 7 days/yr
- Hot days in 30 yrs
- 22 days/yr
Wind risk 2/10 · Minimal
- Chance of severe wind over 30 yrs
- —
Air-quality risk 2/10 · Minimal
- Unhealthy air days now
- 1 days/yr
- Unhealthy air days in 30 yrs
- 1 days/yr
Risk factors via First Street. Map © Google.
Why this score? — see what drove the F grade
The composite is a weighted blend of 9 inputs, each scored 0–100. Each bar is that input's sub-score; the figure is the points it added to the 100-point composite (weight × sub-score).
- ARV discount +7.5/15.0
- Cash flow +5.6/30.0
- Livability +3.8/5.0
- Rent growth +2.9/5.0
- Schools +2.6/10.0
- Condition / age +2.5/5.0
- 1% rule +1.1/10.0
- DSCR +0.0/10.0
- Appreciation +0.0/10.0
$1
🖨 Deal sheet 📄 Offer letter ✓ Due diligence
Listing remarks
REAL ESTATE AUCTION THURSDAY, MAY 28th AT 6:00 P. M. : Set on 35± acres adjoining Johnson City city limits, this rare offering combines open land, privacy, scenic views, and exceptional convenience in one property. Improved with a spacious 2,500± sq. ft. brick ranch featuring 4 bedrooms, 3 full baths, multiple living areas, updated flooring, metal roof, and private well, the property offers outstanding potential for personal ownership, investment, recreation, or future development opportunities. With over 400 ft. of frontage on Sinking Creek Road and surrounded by growing city-served areas, properties of this size and location are becoming increasingly difficult to find. Johns
Key facts
- Privacy and space
- Private well
- 35 acres
Tags
Property features AI
Exterior
- Parking: 2-car garage
- Security: Smoke detectors
- Utilities: Private well water; Septic tank; Electricity connected; Cable available/connected; Water available
- Home design: Single-family house; One level; Residential property on approximately 35.67 acres; Zoned A-1 (agricultural)
- Construction: Brick construction; Block foundation; Metal roof; Basement: full, block foundation, partially finished, interior and exterior entry, walk-out access
- Exterior features: Covered front porch; Cleared, partially wooded, pasture with rolling slope
Interior
- Kitchen: Built-in electric oven; Dishwasher; Microwave
- Bedrooms: Total rooms: 9
- Flooring: Carpet; Vinyl
- Bathrooms: 3 full bathrooms
- Heating & cooling: Central heating; Fireplace heating (wood); 2 fireplaces (masonry/stone; one in den); Central air; Ceiling fans
- Interior features: Built-in features; Entrance foyer; Laminate countertops; Insulated windows; Dehumidifier
- Laundry & utility: Washer hookup; Electric dryer hookup
Neighborhood map
What this means for you Summary
Snapshot
- This is a 4-bed/2.0-bath single-family listed at $1.
Deal economics
- At list price, monthly cash flow is $-714 ($-9k/yr) — negative.
- The deal already cash-flows at list — no discount required.
- Meets the 1% rule at list price ($2k rent vs $1).
- Cap rate 3.8% vs local median 3.1% in Johnson City — meaningfully above typical; check what's discounted (condition, days-on-market, listing class) to confirm the premium yield is real.
Location & tenants
- Location reads 76/100 on livability (#8 in TN, #3,349 nationally) — a middle-class / working-renter tenant base. Strengths: amenities A+, cost of living A+, health & safety A; Watch: crime D, commute F, employment F.
- Washington County (suburban): math 26% / reading 34% proficiency, ranked #54 of 139 in TN (top 39%) — families likely to look elsewhere, expect single-tenant / working-renter base with shorter leases.
- Zoned schools: Lamar Elementary (math 16% / reading 23%, grade F, #654 of 952 statewide, top 72%, 421 students, 0% FRL); David Crockett High School (math 25% / reading 39%, grade F, #56 of 332 statewide, top 20%, 1,181 students, 0% FRL) — zoned schools average 0% FRL vs 41% district-wide (41 pts lower); this property's tenant base skews higher-income than the district average.
- Market conditions: Rents rising (+1.5%/yr); 207 active listings in the ZIP; 3 comparable units currently listed for rent nearby; rentals at typical pace (median 21d on market — plan ~3-4 weeks tenant-placement turnaround); 1,155 units permitted in Washington County in 2024 (437 in 5+ unit buildings).
- At $2,060/mo this rent would consume 47% of the median local household income ($52k/yr) (locally 2254% of renters already pay >50% of income on rent) — very limited rent-growth headroom before tenants either downsize or default.
Forward outlook
- Local home prices are declining (-3.0%/yr); year-one equity from $2k of loan paydown is wiped out by about $10k of value loss. Plan a longer hold.
- Washington County population projected at +9% by 2050 — modest demand growth; plan on rents tracking national, not racing it.
Negotiation context
- It's been on market 26 days — a 2% lower offer ($0) is reasonable based on typical stale-listing flexibility.
Risks & watch-outs
- Watch-outs: property tax is 508167.0% of price.
- Climate carrying-cost: moderate wildfire risk — expect insurance premiums to compound above CPI over the hold.
Questions for the listing agent
- What do current leases actually rent for vs. the listed asking? Can we see a recent rent roll and the last 12 months of T-12 income?
- Built in 1976 — when were the roof, HVAC, electrical panel, plumbing, and water heater last replaced?
- Property tax is high relative to price — has the assessment been appealed recently, and will the sale trigger a re-assessment?
- Is there a deadline driving the sale (1031 exchange, divorce, estate, relocation)? That informs how much negotiation room exists.
- Crime grade is D in this area — have there been break-ins, vandalism, or insurance claims at this property in the last 3 years? What carrier currently insures it and at what premium?
- The area grade is low — what's the realistic commute time and amenity access for the typical tenant pool here? Any planned neighborhood developments (good or bad) we should know about?
- What's the average days-on-market for RENTAL listings here right now (not sales)? A rising rental-DOM trend means longer vacancies and softer asking-rent achievability than the comps imply.
- What's the recent tenant-quality profile in this submarket — average credit score on applications, eviction rate, late-payment / NSF rate, and stable-employment percentage? A property-management company in the area should have these aggregated.
- How much new for-sale + rental construction is in the pipeline within 1–3 miles? Heavy new supply typically softens prices + rents 12–24 months out; constrained supply supports both.
Investment metrics
- 1% rule
- 0.61% ✗
- Cap rate
- 3.76%
- Cash-on-cash
- -9.03%
- DSCR
- 0.60
- GRM
- 13.7
CMA / ARV
- ARV (on-the-fly)
- $338,778
- Comps found
- 8
Show comp detail 8 sales within ~0.75 mi
| Address | Dist | Beds/Ba | Sqft | Sold | Price | $/sf | Match |
|---|---|---|---|---|---|---|---|
| 1712 Colonial Ridge Rd | 0.47mi | 3/2.5 (-1) | 1,914 (0%) | 9mo | $339,000 | $177 | 63 |
| 1906 Cherokee Rd | 0.67mi | 4/2.5 | 1,932 (+1%) | 5mo | $414,900 | $215 | 61 |
| 1903 Triangle Rd | 0.32mi | 3/2.0 (-1) | 1,730 (-10%) | 7mo | $242,350 | $140 | 58 |
| 5 Loire Ct | 0.56mi | 3/2.0 (-1) | 1,993 (+4%) | 12mo | $380,000 | $191 | 52 |
| 1814 Triangle Rd | 0.43mi | 3/2.0 (-1) | 2,078 (+9%) | 10mo | $360,000 | $173 | 52 |
| 1527 Sun Valley Rd | 0.54mi | 3/2.0 (-1) | 1,760 (-8%) | 15mo | $320,000 | $182 | 44 |
| 1904 Paty Dr | 0.60mi | 3/2.5 (-1) | 1,980 (+3%) | 20mo | $341,000 | $172 | 42 |
| 1511 Sun Valley Rd | 0.50mi | 3/1.5 (-1) | 1,768 (-8%) | 20mo | $208,000 | $118 | 40 |
Match score weights: distance 35% · size 25% · config 20% · recency 20%. Top-matched comps best support the ARV.
Projected returns pro-forma
-3.0% appreciation · 1.51% rent growth · sell at horizon
- IRR
- -34.0%
- Equity multiple
- -0.09×
- Total profit
- $-103,368
- Equity at exit
- $50,513
- IRR
- -52.9%
- Equity multiple
- -0.69×
- Total profit
- $-160,540
- Equity at exit
- $29,291
Cash invested: $94,858 (down + closing). Projections, not guarantees.
Landlord ↔ Tenant lean methodology
- Overall (STATE)
- 87 Strongly Landlord-Friendly
- State Tennessee
- 87 Strongly Landlord-Friendly · R+13
- County
- — inherits STATE
- City
- — inherits STATE
ZIP-level market 37604
- Home prices YoY
- -26.1%
- Rents YoY
- 1.5%
- Active inventory
- 207
Monthly cashflow live
- Estimated rent
- $2,060 medium interval (Pro) →
- Mortgage (P&I)
- −$1,777
- Tax est. 1.5%
- −$423 /mo · $5,082/yr
- Insurance
- −$141
- HOA
- −$0
- Vacancy / Maint / Mgmt
- −$433
- Net cashflow
- $-714
Break-even live
UW: 25.0% down · 7.5% · 30yr · 1.5% tax · 5.0% vac · 8.0% maint · 8.0% mgmt
Financing live
Cash to close
- Down payment
- $84,694
- Closing costs
- $10,163
- Reserves months
- —
- Total cash needed
- —
Loan-product check · same deal, 3 products live
Conventional
25% down · 7.5% · 30yr
- Down + closing
- —
- Monthly P&I
- —
- Monthly cashflow
- —
- DSCR
- —
- Eligible?
- —
Personal DTI + credit; lowest rate.
DSCR
20% down · 8.5% · 30yr
- Down + closing
- —
- Monthly P&I
- —
- Monthly cashflow
- —
- DSCR
- —
- Eligible?
- —
No personal income docs; deal must DSCR.
Hard money
10% down · 12.0% · 12mo
- Down + closing
- —
- Monthly P&I
- —
- Monthly cashflow
- —
- DSCR
- —
- Eligible?
- —
Short-term bridge; refi at stabilization.
Rent comps 3 comps
| Address | Beds | Baths | Sqft | Rent | $/sqft | DOM | Units | Dist |
|---|---|---|---|---|---|---|---|---|
| 2205 Forest Acres Dr Johnson City, TN | 4.0 | 2.0 | 1932 | $2,200 | $1.14 | 13d | 1 | 1.00mi |
| 2 Horseshoe Bnd Johnson City, TN | 4.0 | 3.0 | 2042 | $2,250 | $1.10 | 21d | 1 | 1.10mi |
| 1608 Herrin Dr Johnson City, TN | 3.0 | 2.0 | 1528 | $1,450 | $0.95 | 21d | 1 | 1.16mi |
Listing history 7 events
-
2026-06-09days on market $1 Active 26 DOM
-
2026-06-08days on market $1 Active 25 DOM
-
2026-06-07days on market $1 Active 24 DOM
-
2026-06-05days on market $1 Active 21 DOM
-
2026-06-02pricedays on market $1 Active 19 DOM
-
2026-05-08Active
-
2025-06-06price $1,700,000
ⓘ Source: listings_history table (triggers on properties + properties_extension) + one-shot
backfill from property_details.listing_events for pre-trigger history.
Climate risk First Street
- Flood 1/10 Low FEMA zone X (unshaded) · 0% chance over 30 yrs
- Wildfire 5/10 Major
- Heat 4/10 Moderate 7 d/yr ≥95°F today · 22 d/yr by 30 yrs out
- Wind 2/10 Low
- Air quality 2/10 Low 1 unhealthy d/yr today · 1 by 30 yrs out
Nearby sold comps map
Loading sold comps map…
Walkable amenities ~0.75 mi
Loading nearby amenities…
Taxation est. · year 1
- Rental income
- $24,721
- − Mortgage interest
- −$18,977
- − Property taxes
- −$5,082
- − Insurance
- −$1,694
- − Repairs & maintenance
- −$1,978
- − Management
- −$1,978
- − Depreciation
- −$9,855
- Taxable loss
- −$14,842
- Est. tax savings @ 24.0%
- +$3,562
- After-tax cash flow
- $-5,003/yr
For passive investors: Depreciation is non-cash, so a rental often shows a tax loss while cash-flowing — sheltering income. Rental losses are passive: they offset passive income freely, and up to $25,000/yr can offset ordinary (W-2) income if you actively participate and your MAGI is under $100k (phasing out to $0 by $150k); unused losses carry forward. On sale, claimed depreciation is recaptured at up to 25%, and gains may owe capital-gains tax (a 1031 exchange can defer both). Figures are a year-1 estimate at your 24.0% rate — not tax advice; consult a CPA.
Schools (NCES district)
- District
- Washington County
- NCES district ID
- 4704380
- Math proficiency
- 26% ▼ -21.00%
- Reading proficiency
- 34% ▼ -11.00%
- Median HH income
- $46,542
- Composite
- 25.85/100
- National rank
- #7350
- State rank
- #54 of 139 in TN
Livability — Johnson City
- Score
- 76/100
- State rank
- #8
- US rank
- #3349
Category grades
Schools grade is shown separately in the Schools card above.
Census & demographics
- County
- Washington County · 129,006 people
- City population
- 99,926
- Metro
- Johnson City, TN
- Population (ZIP)
- 39,097
- Household income
- $52,345
- Rent vs Own
- Severe rent burden
- 2254.0
Population outlook (Washington County) Hauer SSP2
- Today (2025)
- 132,816 people
- By 2030
- 135,823 · +2.3%
- By 2040
- 140,897 · +6.1%
- By 2050
- 145,073 · +9.2%
- By 2075
- 156,386 · +17.7%
- By 2100
- 159,893 · +20.4%
Race, ethnicity, and origin ACS 2023
- Neighborhood character
- Predominantly White (83%)
- Race & ethnicity
- White 83% Hispanic / Latino 6% Black 6% Two or more races 5% Asian 1%
- Hispanic origin (detail)
- Mexican 3%
- Common ancestry
- Slovak 3% Serbian 3% Italian 3%
- Foreign-born
- 4% · Canada
- Languages at home
- 94% English-only · Spanish 4% Other Indo-European 1%
Political lean MEDSL · Washington
- 2024 margin
- Solid R (+39.5) · D 29.6% · R 69.1% · Other 1.3%
- 2008→2024 swing
- -6.0pp toward R · 2008: -33.5pp · 2024: -39.5pp
- All cycles
- 2024: R+39.5 2020: R+36.2 2016: R+42.9 2012: R+38.5 2008: R+33.5
Not yet ingested
- Civics
- —
Market trends
- HPI YoY
- ▼ -97.73%
- Current HPI
- 277.1137
- Rent YoY
- ▲ 1.51%
- Metro
- Johnson City, TN
- State GDP YoY
- ▲ 2.78%
- F500 in state
- 22
Industry mix (Fortune 500 HQ in TN)
| Industry | F500 HQs | Revenue |
|---|---|---|
| Healthcare | 3 | $91B |
|
||
| Retail | 3 | $72B |
|
||
| Transportation / Logistics | 1 | $88B |
|
||
| Paper / Packaging | 1 | $19B |
|
||
| Insurance | 1 | $13B |
|
||
| Energy | 1 | $12B |
|
||
Price history
2 events — show timeline
- 2026-05-08 Listed — TVRMLS
- 2025-06-06 Price Changed $1,700,000 TVRMLS
Property tax history
+4.6%/yrLatest (2025): $1,390 · +0.0% YoY. Source: county tax records.
Cash-flow waterfall
monthlySold comps — $/sqft
last 12 mo · ≤1 miLoading sold comps…