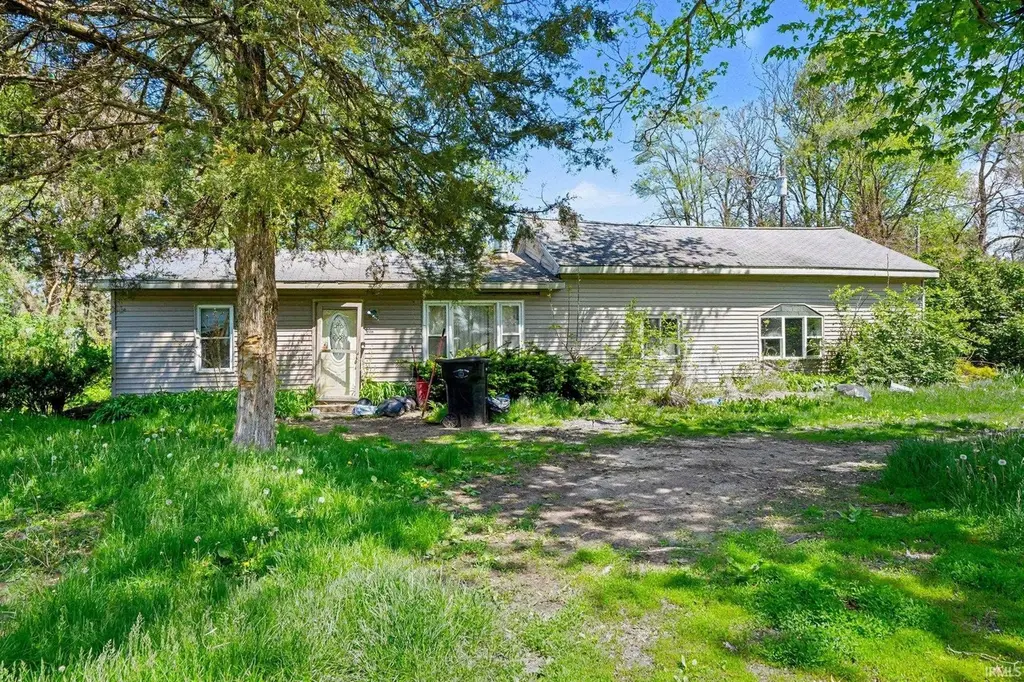
10841 Toledo Ave
Osceola, IN 46561
$99,000B-
2 bd · 1.0 ba ·
2,080 sqft ·
Built 1935
· SingleFamily
· Pending
· 14 DOM
Cashflow @ list (25.0% down · 7.5%)
Estimated rent
$1,378/mo
Mortgage (P&I)
−$519
Tax + insurance
−$203
HOA
−$0
Vac / Maint / Mgmt
−$289
Net cashflow
$366/mo
Annual
$4,396/yr
Cap rate
10.73%
Cash-on-cash
15.86%
DSCR
1.71
1% rule
1.39%
Cash to close
$27,720
Investor read
- This is a 2-bed/1.0-bath single-family listed at $99k.
- At list price, monthly cash flow is $366 ($4k/yr) — positive.
- The deal already cash-flows at list — no discount required.
- Meets the 1% rule at list price ($1k rent vs $99k).
- Only 14 days on market — expect competitive offers; lowballing is unlikely to land.
- Local home prices are declining (-3.0%/yr); year-one equity from $684 of loan paydown is wiped out by about $3k of value loss. Plan a longer hold.
- Location reads 70/100 on livability (#144 in IN) — a middle-class / working-renter tenant base. Strengths: crime A+, cost of living A+, housing A+; Watch: amenities F, commute F, health & safety D-.
- Penn-Harris-Madison School Corporation (suburban): math 54% / reading 64% proficiency, ranked #19 of 301 in IN (top 6%) — acceptable for families but not a draw, mixed tenant base, ~2y average lease.
- Zoned schools: Bittersweet Elementary School (math 71% / reading 64%, grade B+, #52 of 994 statewide, top 5%, 520 students, 28% FRL); Schmucker Middle School (math 40% / reading 56%, grade C-, #60 of 330 statewide, top 18%, 1,004 students, 36% FRL); Penn High School (math 53% / reading 83%, grade B, #22 of 369 statewide, top 6%, 3,624 students, 27% FRL).
- Watch-outs: built in 1935 — expect roof / HVAC / electrical / plumbing capex.
- Market conditions: 112 active listings in the ZIP; 754 units permitted in St. Joseph County in 2024 (460 in 5+ unit buildings).
- 4 sale attempts since 9y ago with the ask held roughly flat each time — persistent listings suggest the price (not the market) is what's stuck; bring a comps-based counter.
- At projected returns (-3.0% appreciation + 3.0% rent growth), your $28k cash investment doubles in ~8 years — after that, you're playing with house money.
- Cap rate 10.7% vs local median 3.4% in Osceola — top-decile yield for the area; either an underpriced asset or a hidden risk that comps aren't pricing in. Stress-test before assuming the spread holds.
Questions for listing agent
- Built in 1935 — when were the roof, HVAC, electrical panel, plumbing, and water heater last replaced?
- Is there a deadline driving the sale (1031 exchange, divorce, estate, relocation)? That informs how much negotiation room exists.
- What's the average days-on-market for RENTAL listings here right now (not sales)? A rising rental-DOM trend means longer vacancies and softer asking-rent achievability than the comps imply.
- What's the recent tenant-quality profile in this submarket — average credit score on applications, eviction rate, late-payment / NSF rate, and stable-employment percentage? A property-management company in the area should have these aggregated.
- How much new for-sale + rental construction is in the pipeline within 1–3 miles? Heavy new supply typically softens prices + rents 12–24 months out; constrained supply supports both.
CashFlowRE · CFR-MVCTERFMPP7XGF
· Data 1 week ago
cashflowre.app · 2026-05-29