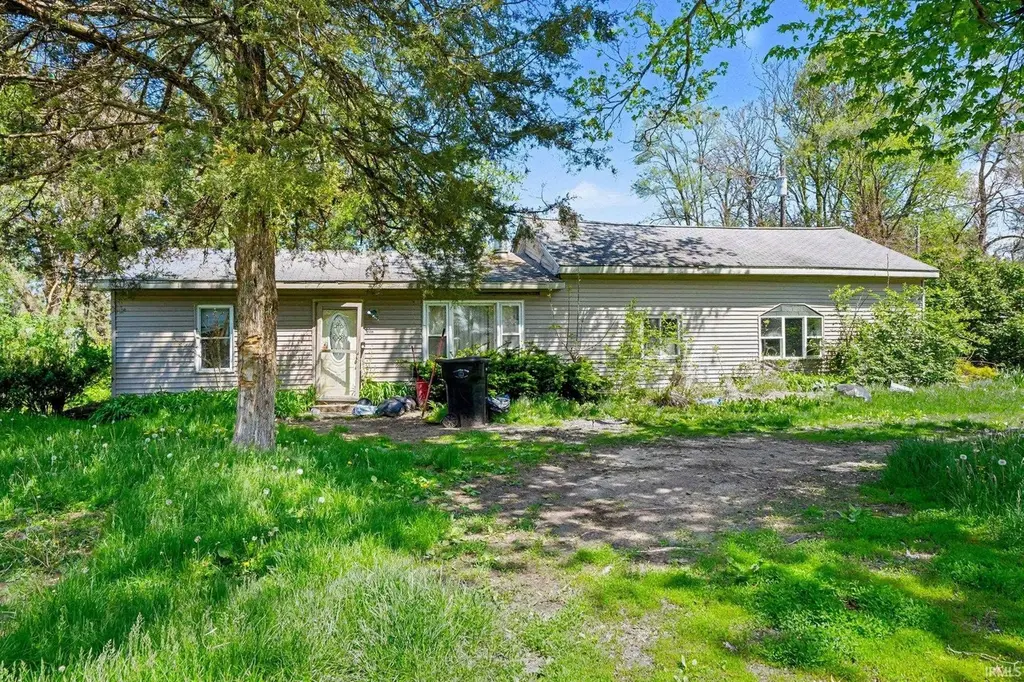
10841 Toledo Ave · Osceola, IN
Flood risk 3/10 · Minor
- FEMA flood zone
- X (unshaded)
- Chance of flooding over 30 yrs
- 0.1%
- Est. flood insurance / yr
- $507 – $1,088
Fire risk 1/10 · Minimal
- Est. fire insurance / yr
- $717 – $1,331
Heat risk 2/10 · Minimal
- Hot days now (above 101°F)
- 7 days/yr
- Hot days in 30 yrs
- 16 days/yr
Wind risk 2/10 · Minimal
- Chance of severe wind over 30 yrs
- —
Air-quality risk 3/10 · Minor
- Unhealthy air days now
- 2 days/yr
- Unhealthy air days in 30 yrs
- 3 days/yr
Risk factors via First Street. Map © Google.
Why this score? — see what drove the B- grade
The composite is a weighted blend of 9 inputs, each scored 0–100. Each bar is that input's sub-score; the figure is the points it added to the 100-point composite (weight × sub-score).
- Cash flow +29.9/30.0
- DSCR +10.0/10.0
- 1% rule +8.9/10.0
- ARV discount +7.5/15.0
- Schools +5.1/10.0
- Livability +3.5/5.0
- Rent growth +2.5/5.0
- Condition / age +2.5/5.0
- Appreciation +0.0/10.0
$99,000
🖨 Deal sheet 📄 Offer letter ✓ Due diligence
Listing remarks
Great investor opportunity in Penn Township! Situated on a spacious corner lot, this property offers strong potential for renovation or redevelopment. Home is being sold as-is and requires significant work, making it ideal for investors or buyers looking to build equity. Bring your vision and unlock the possibilities this property has to offer.
Key facts
- Spacious corner lot
- 0.41 acre lot
- Built 1935
Tags
Property features AI
Finance
- Other: Property listed by Cressy & Everett - Elkhart
Exterior
- Utilities: Private well water; Septic tank sewer
- Home design: Single-family residence; Site-built home; One story
- Construction: Vinyl siding
- Exterior features: Corner lot; Lot dimensions approximately 81 x 219
Interior
- Bathrooms: 1 full bathroom (main level)
- Heating & cooling: Forced air heating; No central air
- Interior features: 9 total rooms; Crawl space basement (none finished)
- Laundry & utility: Laundry on main level
Neighborhood map
What this means for you Summary
Snapshot
- This is a 2-bed/1.0-bath single-family listed at $99k.
Deal economics
- At list price, monthly cash flow is $366 ($4k/yr) — positive.
- The deal already cash-flows at list — no discount required.
- Meets the 1% rule at list price ($1k rent vs $99k).
- Cap rate 10.7% vs local median 3.4% in Osceola — top-decile yield for the area; either an underpriced asset or a hidden risk that comps aren't pricing in. Stress-test before assuming the spread holds.
Location & tenants
- Location reads 70/100 on livability (#144 in IN) — a middle-class / working-renter tenant base. Strengths: crime A+, cost of living A+, housing A+; Watch: amenities F, commute F, health & safety D-.
- Penn-Harris-Madison School Corporation (suburban): math 54% / reading 64% proficiency, ranked #19 of 301 in IN (top 6%) — acceptable for families but not a draw, mixed tenant base, ~2y average lease.
- Zoned schools: Bittersweet Elementary School (math 71% / reading 64%, grade B+, #52 of 994 statewide, top 5%, 520 students, 28% FRL); Schmucker Middle School (math 40% / reading 56%, grade C-, #60 of 330 statewide, top 18%, 1,004 students, 36% FRL); Penn High School (math 53% / reading 83%, grade B, #22 of 369 statewide, top 6%, 3,624 students, 27% FRL).
- Market conditions: 112 active listings in the ZIP; 754 units permitted in St. Joseph County in 2024 (460 in 5+ unit buildings).
Forward outlook
- Local home prices are declining (-3.0%/yr); year-one equity from $684 of loan paydown is wiped out by about $3k of value loss. Plan a longer hold.
- At projected returns (-3.0% appreciation + 3.0% rent growth), your $28k cash investment doubles in ~8 years — after that, you're playing with house money.
Negotiation context
- Only 14 days on market — expect competitive offers; lowballing is unlikely to land.
- 4 sale attempts since 9y ago with the ask held roughly flat each time — persistent listings suggest the price (not the market) is what's stuck; bring a comps-based counter.
Risks & watch-outs
- Watch-outs: built in 1935 — expect roof / HVAC / electrical / plumbing capex.
Questions for the listing agent
- Built in 1935 — when were the roof, HVAC, electrical panel, plumbing, and water heater last replaced?
- Is there a deadline driving the sale (1031 exchange, divorce, estate, relocation)? That informs how much negotiation room exists.
- What's the average days-on-market for RENTAL listings here right now (not sales)? A rising rental-DOM trend means longer vacancies and softer asking-rent achievability than the comps imply.
- What's the recent tenant-quality profile in this submarket — average credit score on applications, eviction rate, late-payment / NSF rate, and stable-employment percentage? A property-management company in the area should have these aggregated.
- How much new for-sale + rental construction is in the pipeline within 1–3 miles? Heavy new supply typically softens prices + rents 12–24 months out; constrained supply supports both.
Investment metrics
- 1% rule
- 1.39% ✓
- Cap rate
- 10.73%
- Cash-on-cash
- 15.86%
- DSCR
- 1.71
- GRM
- 6.0
CMA / ARV
- ARV (median comp)
- $290,967
- List price
- $99,000
- Delta
- -65.98%
- Verdict
- UNDERPRICED
- Comps
- 20 within 1.0 mi
Show comp detail 12 sales within ~0.75 mi
| Address | Dist | Beds/Ba | Sqft | Sold | Price | $/sf | Match |
|---|---|---|---|---|---|---|---|
| 55739 Setter Ln | 0.50mi | 3/2.0 (+1) | 2,097 (+1%) | 7mo | $310,500 | $148 | 60 |
| 10532 Toledo Ave | 0.32mi | 3/2.0 (+1) | 1,960 (-6%) | 10mo | $287,000 | $146 | 58 |
| 11347 Mckinley Hwy | 0.52mi | 3/1.5 (+1) | 2,024 (-3%) | 14mo | $249,000 | $123 | 52 |
| 11476 Lauren Dr | 0.68mi | 3/2.0 (+1) | 2,175 (+5%) | 3mo | $321,000 | $148 | 50 |
| 11358 Lauren Dr | 0.55mi | 3/2.0 (+1) | 1,970 (-5%) | 10mo | $280,000 | $142 | 49 |
| 55566 Labrador Ct | 0.39mi | 3/2.5 (+1) | 2,324 (+12%) | 3mo | $355,000 | $153 | 48 |
| 55759 Apple Rd | 0.49mi | 3/1.5 (+1) | 1,780 (-14%) | 2mo | $259,000 | $146 | 44 |
| 55855 Season Ct | 0.61mi | 3/2.5 (+1) | 1,909 (-8%) | 8mo | $345,000 | $181 | 40 |
| 55815 Wild Game Dr | 0.48mi | 3/3.0 (+1) | 2,386 (+15%) | 2mo | $365,000 | $153 | 39 |
| 54805 W Sunray Dr | 0.67mi | 3/2.5 (+1) | 2,246 (+8%) | 8mo | $295,000 | $131 | 38 |
| 55161 Patrician Park Dr | 0.69mi | 3/2.0 (+1) | 1,877 (-10%) | 6mo | $295,000 | $157 | 37 |
| 54755 Columbia Bay Nbv 230 Dr | 0.73mi | 3/2.5 (+1) | 2,318 (+11%) | 16mo | $599,000 | $258 | 23 |
Match score weights: distance 35% · size 25% · config 20% · recency 20%. Top-matched comps best support the ARV.
Projected returns pro-forma
-3.0% appreciation · 3.0% rent growth · sell at horizon
- IRR
- 6.8%
- Equity multiple
- 1.26×
- Total profit
- $7,335
- Equity at exit
- $14,761
- IRR
- 16.1%
- Equity multiple
- 2.32×
- Total profit
- $36,612
- Equity at exit
- $8,560
Cash invested: $27,720 (down + closing). Projections, not guarantees.
Landlord ↔ Tenant lean methodology
- Overall (STATE)
- 90 Strongly Landlord-Friendly
- State Indiana
- 90 Strongly Landlord-Friendly · R+11
- County
- — inherits STATE
- City
- — inherits STATE
ZIP-level market 46561
- Home prices YoY
- -27.2%
- Active inventory
- 112
- Price-to-rent
- 6.0×
Monthly cashflow live
- Estimated rent
- $1,378 medium interval (Pro) →
- Mortgage (P&I)
- −$519
- Tax from tax record
- −$162 /mo · $1,940/yr
- Insurance
- −$41
- HOA
- −$0
- Vacancy / Maint / Mgmt
- −$289
- Net cashflow
- $366
Break-even live
UW: 25.0% down · 7.5% · 30yr · 1.5% tax · 5.0% vac · 8.0% maint · 8.0% mgmt
Financing live
Cash to close
- Down payment
- $24,750
- Closing costs
- $2,970
- Reserves months
- —
- Total cash needed
- —
Loan-product check · same deal, 3 products live
Conventional
25% down · 7.5% · 30yr
- Down + closing
- —
- Monthly P&I
- —
- Monthly cashflow
- —
- DSCR
- —
- Eligible?
- —
Personal DTI + credit; lowest rate.
DSCR
20% down · 8.5% · 30yr
- Down + closing
- —
- Monthly P&I
- —
- Monthly cashflow
- —
- DSCR
- —
- Eligible?
- —
No personal income docs; deal must DSCR.
Hard money
10% down · 12.0% · 12mo
- Down + closing
- —
- Monthly P&I
- —
- Monthly cashflow
- —
- DSCR
- —
- Eligible?
- —
Short-term bridge; refi at stabilization.
Listing history 8 events
-
2026-06-09statusdays on market $99,000 Pending 14 DOM
-
2026-06-08days on market $99,000 Active 13 DOM
-
2026-06-07statusdays on market $99,000 Active 12 DOM
-
2026-05-17status Pending 346-char remark
-
2026-05-15status Active 346-char remark
-
2026-05-11status Pending 346-char remark
-
2026-05-04$99,000 Active 346-char remark
-
2017-11-09$82,000
ⓘ Source: listings_history table (triggers on properties + properties_extension) + one-shot
backfill from property_details.listing_events for pre-trigger history.
Tax reassessment forecast IN · Partial reset (capped growth)
- Current annual tax
- $1,940 · $162/mo
- Projected year-2 tax
- $1,940 · $162/mo
- Expected delta
- $0/yr ($0/mo · 0.0%)
ⓘ Screening estimate from a state-policy table — verify with the county assessor before closing.
Climate risk First Street
- Flood 3/10 Moderate FEMA zone X (unshaded) · 10% chance over 30 yrs
- Wildfire 1/10 Low
- Heat 2/10 Low 7 d/yr ≥101°F today · 16 d/yr by 30 yrs out
- Wind 2/10 Low
- Air quality 3/10 Moderate 2 unhealthy d/yr today · 3 by 30 yrs out
Nearby sold comps map
Loading sold comps map…
Walkable amenities ~0.75 mi
Loading nearby amenities…
Taxation est. · year 1
- Rental income
- $16,533
- − Mortgage interest
- −$5,546
- − Property taxes
- −$1,940
- − Insurance
- −$495
- − Repairs & maintenance
- −$1,323
- − Management
- −$1,323
- − Depreciation
- −$2,880
- Taxable income
- $3,027
- Est. tax owed @ 24.0%
- −$727
- After-tax cash flow
- $3,670/yr
For passive investors: Depreciation is non-cash, so a rental often shows a tax loss while cash-flowing — sheltering income. Rental losses are passive: they offset passive income freely, and up to $25,000/yr can offset ordinary (W-2) income if you actively participate and your MAGI is under $100k (phasing out to $0 by $150k); unused losses carry forward. On sale, claimed depreciation is recaptured at up to 25%, and gains may owe capital-gains tax (a 1031 exchange can defer both). Figures are a year-1 estimate at your 24.0% rate — not tax advice; consult a CPA.
Schools (NCES district)
- District
- Penn-Harris-Madison School Corporation
- NCES district ID
- 1808760
- Math proficiency
- 54% ▼ -11.00%
- Reading proficiency
- 64% ▼ -6.00%
- Median HH income
- $59,421
- Composite
- 51.11/100
- National rank
- #1764
- State rank
- #19 of 301 in IN
Livability — Osceola
- Score
- 70/100
- State rank
- #144
- US rank
- #7375
Category grades
Schools grade is shown separately in the Schools card above.
Census & demographics
- City population
- 14,499
- Population (ZIP)
- 14,499
Population outlook (St. Joseph County) Hauer SSP2
- Today (2025)
- 273,186 people
- By 2030
- 273,594 · +0.1%
- By 2040
- 271,641 · -0.6%
- By 2050
- 269,187 · -1.5%
- By 2075
- 263,136 · -3.7%
- By 2100
- 245,659 · -10.1%
Race, ethnicity, and origin ACS 2023
- Neighborhood character
- Predominantly White (87%)
- Race & ethnicity
- White 87% Hispanic / Latino 9% Two or more races 7% Black 2% Asian 1%
- Hispanic origin (detail)
- Mexican 4% Puerto Rican 4%
- Common ancestry
- Romanian 5% Italian 2% Lithuanian 1%
- Foreign-born
- 3% · Canada
- Languages at home
- 95% English-only · Spanish 3% Arabic 1% Korean 1%
Political lean MEDSL · St. Joseph
- 2024 margin
- Toss-up / Even · D 50.0% · R 48.5% · Other 1.5%
- 2008→2024 swing
- -15.6pp toward R · 2008: 17.1pp · 2024: 1.5pp
- All cycles
- 2024: D+1.5 2020: D+5.8 2016: D+0.2 2012: D+3.5 2008: D+17.1
Not yet ingested
- Civics
- —
Market trends
- HPI YoY
- ▼ -81.38%
- Current HPI
- 217.644
- Rent YoY
- —
- Metro
- —
- State GDP YoY
- ▲ 2.90%
- F500 in state
- 18
Industry mix (Fortune 500 HQ in IN)
| Industry | F500 HQs | Revenue |
|---|---|---|
| Industrial Machinery | 2 | $37B |
|
||
| Healthcare | 1 | $177B |
|
||
| Pharmaceuticals | 1 | $45B |
|
||
| Metals / Steel | 1 | $18B |
|
||
| Agriculture | 1 | $17B |
|
||
| Packaging | 1 | $12B |
|
||
Price history
+9.8% since first listed8 events — show timeline
- 2026-06-11 Sold (MLS) $90,000 IRMLS
- 2026-06-09 Pending — IRMLS
- 2026-06-04 Relisted — IRMLS
- 2026-05-17 Pending — IRMLS
- 2026-05-15 Relisted — IRMLS
- 2026-05-11 Pending — IRMLS
- 2026-05-04 Listed $99,000 IRMLS
- 2017-11-09 Listed $82,000 IRMLS
Property tax history
+16.3%/yrLatest (2025): $1,940 · -2.1% YoY. Source: county tax records.
Cash-flow waterfall
monthlySold comps — $/sqft
last 12 mo · ≤1 miLoading sold comps…