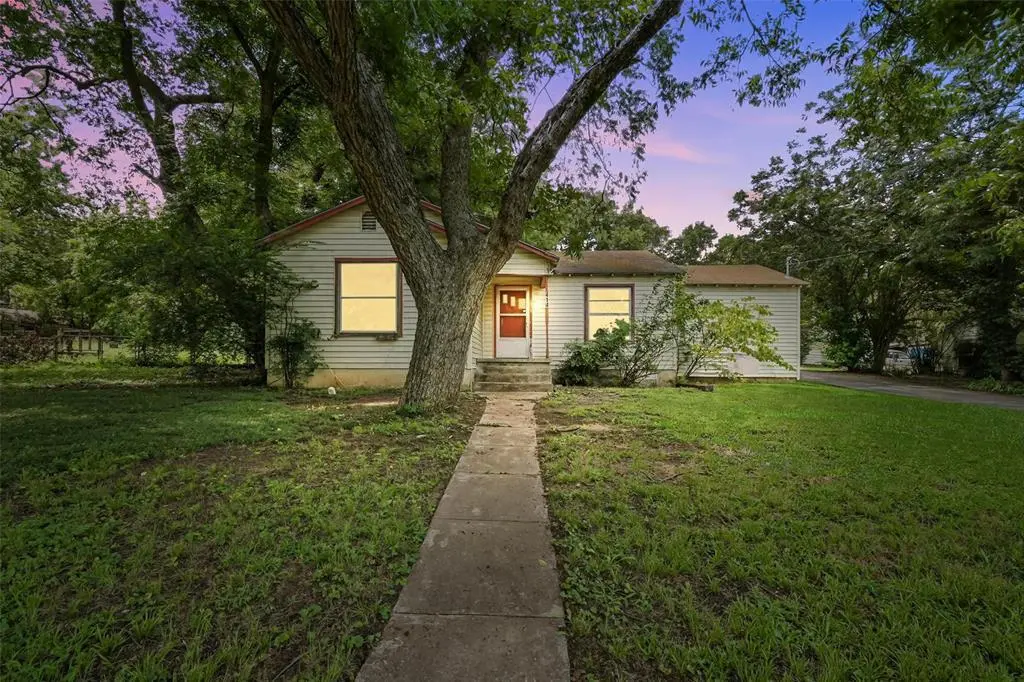
414 S Broadway St
Bells, TX 75414
$100,000D+
2 bd · 1.0 ba ·
1,034 sqft ·
Built 1936
· SingleFamily
· Active
· 111 DOM
Cashflow @ list (25.0% down · 7.5%)
Estimated rent
$1,007/mo
Mortgage (P&I)
−$524
Tax + insurance
−$323
HOA
−$0
Vac / Maint / Mgmt
−$211
Net cashflow
$-52/mo
Annual
$-625/yr
Cap rate
5.67%
Cash-on-cash
-2.23%
DSCR
0.90
1% rule
1.01%
Cash to close
$28,000
Investor read
- This is a 2-bed/1.0-bath single-family listed at $100k.
- At list price, monthly cash flow is $-52 ($-625/yr) — negative.
- To cash-flow at today's rent, offer at most $91k (9.2% below list).
- Meets the 1% rule at list price ($1k rent vs $100k).
- It's been on market 111 days — a 9% lower offer ($91k) is reasonable based on typical stale-listing flexibility.
- Recommended offer: $91k (9.2% below list) — sets the bar for cash-flow.
- Local home prices are declining (-3.0%/yr); year-one equity from $691 of loan paydown is wiped out by about $3k of value loss. Plan a longer hold.
- Location reads 64/100 on livability (#769 in TX) — a middle-class / working-renter tenant base. Strengths: crime A+, cost of living A+, housing A+; Watch: amenities F, commute F.
- Bells ISD (rural): math 63% / reading 53% proficiency, ranked #81 of 826 in TX (top 10%) — acceptable for families but not a draw, mixed tenant base, ~2y average lease.
- Zoned schools: Bells El (math 57% / reading 47%, grade C-, #742 of 4,322 statewide, top 19%, 442 students, 47% FRL); Pritchard J H (math 70% / reading 57%, grade B+, #115 of 1,662 statewide, top 7%, 215 students, 41% FRL); Bells H S (math 57% / reading 62%, grade C+, #275 of 1,632 statewide, top 19%, 306 students, 33% FRL).
- Watch-outs: property tax is 3.4% of price; built in 1936 — expect roof / HVAC / electrical / plumbing capex.
- Market conditions: 68 active listings in the ZIP; 4 comparable units currently listed for rent nearby; rentals at typical pace (median 20d on market — plan ~3-4 weeks tenant-placement turnaround); 2,272 units permitted in Grayson County in 2024 (750 in 5+ unit buildings).
- Grayson County population projected at +12% by 2050 — modest demand growth; plan on rents tracking national, not racing it.
- 2 sale attempts; this cycle's ask has dropped $25k (20%) from the opening price — seller is motivated, your offer sets the floor, not the list.
- Climate carrying-cost: moderate wind risk, 26% chance of damaging wind over 30y; major wildfire risk; extreme-heat days projected 7→21/yr by 2055 (HVAC capex compounding) — expect insurance premiums to compound above CPI over the hold.
- Cap rate 5.7% vs local median 2.3% in Bells — top-decile yield for the area; either an underpriced asset or a hidden risk that comps aren't pricing in. Stress-test before assuming the spread holds.
Questions for listing agent
- What do current leases actually rent for vs. the listed asking? Can we see a recent rent roll and the last 12 months of T-12 income?
- It's been on market 111 days. Have you received any prior offers? Is the seller open to a 9% concession, seller financing, or rate buy-down credit?
- Built in 1936 — when were the roof, HVAC, electrical panel, plumbing, and water heater last replaced?
- Property tax is high relative to price — has the assessment been appealed recently, and will the sale trigger a re-assessment?
- Why hasn't it sold? Are there any deal-killer items the seller is aware of (foundation, flood, title, zoning, code violations)?
- Is there a deadline driving the sale (1031 exchange, divorce, estate, relocation)? That informs how much negotiation room exists.
- The area grade is low — what's the realistic commute time and amenity access for the typical tenant pool here? Any planned neighborhood developments (good or bad) we should know about?
- What's the average days-on-market for RENTAL listings here right now (not sales)? A rising rental-DOM trend means longer vacancies and softer asking-rent achievability than the comps imply.
CashFlowRE · CFR-MX35H84C243PYE
· Data 22 h ago
cashflowre.app · 2026-05-29