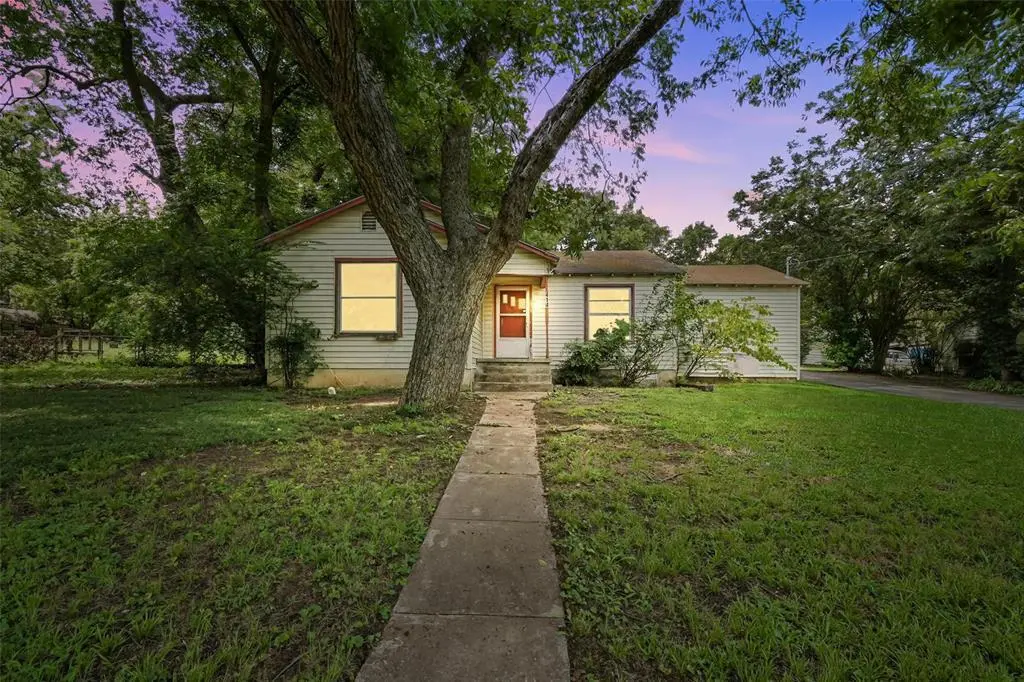
414 S Broadway St · Bells, TX
Flood risk 1/10 · Minimal
- FEMA flood zone
- X (unshaded)
- Chance of flooding over 30 yrs
- 0.0%
- Est. flood insurance / yr
- $507 – $1,088
Fire risk 7/10 · Major
- Est. fire insurance / yr
- $1,222 – $2,270
Heat risk 6/10 · Moderate
- Hot days now (above 109°F)
- 7 days/yr
- Hot days in 30 yrs
- 21 days/yr
Wind risk 5/10 · Moderate
- Chance of severe wind over 30 yrs
- 26.0%
Air-quality risk 2/10 · Minimal
- Unhealthy air days now
- 1 days/yr
- Unhealthy air days in 30 yrs
- 2 days/yr
Risk factors via First Street. Map © Google.
Why this score? — see what drove the D+ grade
The composite is a weighted blend of 9 inputs, each scored 0–100. Each bar is that input's sub-score; the figure is the points it added to the 100-point composite (weight × sub-score).
- ARV discount +15.0/15.0
- Cash flow +10.5/30.0
- 1% rule +5.1/10.0
- Schools +5.0/10.0
- Livability +3.2/5.0
- DSCR +3.0/10.0
- Rent growth +2.5/5.0
- Condition / age +2.5/5.0
- Appreciation +0.0/10.0
$100,000
🖨 Deal sheet (PDF) 📄 Offer letter ✓ Due diligence
Listing remarks MLS
INVESTOR OPPORTUNITY – 1936 FIXER UPPER IN BELLS, TX If you’re looking for your next value-add project, this is it. Built in 1936, this property has strong bones, original hardwood floors ready for restoration, and the kind of character you simply can’t replicate in new construction. This is not a lipstick flip. This is a true renovation opportunity priced accordingly. The structure gives you a solid starting point — now it’s about vision, execution, and margin. Whether you’re a flipper looking for spread, a buy-and-hold investor wanting forced appreciation, or someone who knows how to unlock hidden value, this is your chance to create equity the old-fashioned way. Priced to sell due to condition. Bring your contractor. Bring your numbers. Bring your best offer.
Key facts
- Strong bones
- 0.28 acre lot
- Garage
Tags
Neighborhood map
What this means for you Summary
Snapshot
- This is a 2-bed/1.0-bath single-family listed at $100k.
Deal economics
- At list price, monthly cash flow is $-52 ($-625/yr) — negative.
- To cash-flow at today's rent, offer at most $91k (9.2% below list).
- Meets the 1% rule at list price ($1k rent vs $100k).
- Recommended offer: $91k (9.2% below list) — sets the bar for cash-flow.
- Cap rate 5.7% vs local median 2.3% in Bells — top-decile yield for the area; either an underpriced asset or a hidden risk that comps aren't pricing in. Stress-test before assuming the spread holds.
Location & tenants
- Location reads 64/100 on livability (#769 in TX) — a middle-class / working-renter tenant base. Strengths: crime A+, cost of living A+, housing A+; Watch: amenities F, commute F.
- Bells ISD (rural): math 63% / reading 53% proficiency, ranked #81 of 826 in TX (top 10%) — acceptable for families but not a draw, mixed tenant base, ~2y average lease.
- Zoned schools: Bells El (math 57% / reading 47%, grade C-, #742 of 4,322 statewide, top 19%, 442 students, 47% FRL); Pritchard J H (math 70% / reading 57%, grade B+, #115 of 1,662 statewide, top 7%, 215 students, 41% FRL); Bells H S (math 57% / reading 62%, grade C+, #275 of 1,632 statewide, top 19%, 306 students, 33% FRL).
- Market conditions: 68 active listings in the ZIP; 4 comparable units currently listed for rent nearby; rentals at typical pace (median 20d on market — plan ~3-4 weeks tenant-placement turnaround); 2,272 units permitted in Grayson County in 2024 (750 in 5+ unit buildings).
Forward outlook
- Local home prices are declining (-3.0%/yr); year-one equity from $691 of loan paydown is wiped out by about $3k of value loss. Plan a longer hold.
- Grayson County population projected at +12% by 2050 — modest demand growth; plan on rents tracking national, not racing it.
Negotiation context
- It's been on market 111 days — a 9% lower offer ($91k) is reasonable based on typical stale-listing flexibility.
- 2 sale attempts; this cycle's ask has dropped $25k (20%) from the opening price — seller is motivated, your offer sets the floor, not the list.
Risks & watch-outs
- Watch-outs: property tax is 3.4% of price; built in 1936 — expect roof / HVAC / electrical / plumbing capex.
- Climate carrying-cost: moderate wind risk, 26% chance of damaging wind over 30y; major wildfire risk; extreme-heat days projected 7→21/yr by 2055 (HVAC capex compounding) — expect insurance premiums to compound above CPI over the hold.
Questions for the listing agent
- What do current leases actually rent for vs. the listed asking? Can we see a recent rent roll and the last 12 months of T-12 income?
- It's been on market 111 days. Have you received any prior offers? Is the seller open to a 9% concession, seller financing, or rate buy-down credit?
- Built in 1936 — when were the roof, HVAC, electrical panel, plumbing, and water heater last replaced?
- Property tax is high relative to price — has the assessment been appealed recently, and will the sale trigger a re-assessment?
- Why hasn't it sold? Are there any deal-killer items the seller is aware of (foundation, flood, title, zoning, code violations)?
- Is there a deadline driving the sale (1031 exchange, divorce, estate, relocation)? That informs how much negotiation room exists.
- The area grade is low — what's the realistic commute time and amenity access for the typical tenant pool here? Any planned neighborhood developments (good or bad) we should know about?
- What's the average days-on-market for RENTAL listings here right now (not sales)? A rising rental-DOM trend means longer vacancies and softer asking-rent achievability than the comps imply.
- What's the recent tenant-quality profile in this submarket — average credit score on applications, eviction rate, late-payment / NSF rate, and stable-employment percentage? A property-management company in the area should have these aggregated.
- How much new for-sale + rental construction is in the pipeline within 1–3 miles? Heavy new supply typically softens prices + rents 12–24 months out; constrained supply supports both.
Investment metrics
- 1% rule
- 1.01% ✓
- Cap rate
- 5.67%
- Cash-on-cash
- -2.23%
- DSCR
- 0.90
- GRM
- 8.3
CMA / ARV
- ARV (median comp)
- $169,134
- List price
- $100,000
- Delta
- -40.88%
- Verdict
- UNDERPRICED
- Comps
- 10 within 1.0 mi
Show comp detail 1 sale within ~0.75 mi
| Address | Dist | Beds/Ba | Sqft | Sold | Price | $/sf | Match |
|---|---|---|---|---|---|---|---|
| 110 E Elm | 0.02mi | 3/2.0 (+1) | 1,131 (+9%) | 15mo | $239,500 | $212 | 62 |
Match score weights: distance 35% · size 25% · config 20% · recency 20%. Top-matched comps best support the ARV.
Projected returns pro-forma
-3.0% appreciation · 3.0% rent growth · sell at horizon
- IRR
- -19.8%
- Equity multiple
- 0.31×
- Total profit
- $-19,410
- Equity at exit
- $14,910
- IRR
- -12.5%
- Equity multiple
- 0.26×
- Total profit
- $-20,721
- Equity at exit
- $8,646
Cash invested: $28,000 (down + closing). Projections, not guarantees.
Landlord ↔ Tenant lean methodology
- Overall (STATE)
- 87 Strongly Landlord-Friendly
- State Texas
- 87 Strongly Landlord-Friendly · R+5
- County
- — inherits STATE
- City
- — inherits STATE
ZIP-level market 75414
- Home prices YoY
- -9.3%
- Active inventory
- 68
- Price-to-rent
- 8.3×
Monthly cashflow live
- Estimated rent
- $1,007 medium interval (Pro) →
- Mortgage (P&I)
- −$524
- Tax from tax record
- −$281 /mo · $3,376/yr
- Insurance
- −$42
- HOA
- −$0
- Vacancy / Maint / Mgmt
- −$211
- Net cashflow
- $-52
Break-even live
Sensitivity live
| Price | -10% $5 | -5% $-24 | +0% $-52 | +5% $-80 | +10% $-109 |
|---|---|---|---|---|---|
| Rent | -10% $-132 | -5% $-92 | +0% $-52 | +5% $-12 | +10% $27 |
| Rate | -1.0pp $-2 | -0.5pp $-27 | base $-52 | +0.5pp $-78 | +1.0pp $-104 |
UW: 25.0% down · 7.5% · 30yr · 1.5% tax · 5.0% vac · 8.0% maint · 8.0% mgmt
Financing live
Cash to close
- Down payment
- $25,000
- Closing costs
- $3,000
- Reserves months
- —
- Total cash needed
- —
Loan-product check · same deal, 3 products live
Conventional
25% down · 7.5% · 30yr
- Down + closing
- —
- Monthly P&I
- —
- Monthly cashflow
- —
- DSCR
- —
- Eligible?
- —
Personal DTI + credit; lowest rate.
DSCR
20% down · 8.5% · 30yr
- Down + closing
- —
- Monthly P&I
- —
- Monthly cashflow
- —
- DSCR
- —
- Eligible?
- —
No personal income docs; deal must DSCR.
Hard money
10% down · 12.0% · 12mo
- Down + closing
- —
- Monthly P&I
- —
- Monthly cashflow
- —
- DSCR
- —
- Eligible?
- —
Short-term bridge; refi at stabilization.
Rent comps 4 comps
| Address | Beds | Baths | Sqft | Rent | $/sqft | DOM | Units | Dist |
|---|---|---|---|---|---|---|---|---|
| 244 W McFarland St Bells, TX | 3.0 | 1.0 | 750 | $975 | $1.30 | 19d | 1 | 0.53mi |
| 246 W McFarland St Bells, TX | 3.0 | 1.0 | 750 | $975 | $1.30 | 22d | 1 | 0.54mi |
| 246 W McFarland St Bells, TX | 3.0 | 1.0 | 750 | $975 | $1.30 | 0d | 1 | 0.54mi |
| 309 W Sherman St Unit 309 Bells, TX | 3.0 | 1.0 | 1100 | $1,095 | $1.00 | 0d | 1 | 0.65mi |
Listing history 26 events
-
2026-06-21days on market $100,000 Active 111 DOM
-
2026-06-19days on market $100,000 Active 109 DOM
-
2026-06-18days on market $100,000 Active 108 DOM
-
2026-06-17days on market $100,000 Active 107 DOM
-
2026-06-16days on market $100,000 Active 106 DOM
-
2026-06-15days on market $100,000 Active 105 DOM
-
2026-06-14days on market $100,000 Active 103 DOM
-
2026-06-13days on market $100,000 Active 102 DOM
-
2026-06-10days on market $100,000 Active 100 DOM
-
2026-06-09days on market $100,000 Active 99 DOM
-
2026-06-08days on market $100,000 Active 98 DOM
-
2026-06-07days on market $100,000 Active 97 DOM
-
2026-06-05days on market $100,000 Active 94 DOM
-
2026-06-03days on market $100,000 Active 93 DOM
-
2026-06-02days on market $100,000 Active 92 DOM
-
2026-06-01days on market $100,000 Active 91 DOM
-
2026-05-31days on market $100,000 Active 90 DOM
-
2026-05-30days on market $100,000 Active 89 DOM
-
2026-04-22price $100,000 820-char remark
Show marketing remark (820 chars)
INVESTOR OPPORTUNITY – 1936 FIXER UPPER IN BELLS, TX If you’re looking for your next value-add project, this is it. Built in 1936, this property has strong bones, original hardwood floors ready for restoration, and the kind of character you simply can’t replicate in new construction. This is not a lipstick flip. This is a true renovation opportunity priced accordingly. The structure gives you a solid starting point — now it’s about vision, execution, and margin. Whether you’re a flipper looking for spread, a buy-and-hold investor wanting forced appreciation, or someone who knows how to unlock hidden value, this is your chance to create equity the old-fashioned way. Priced to sell due to condition. Bring your contractor. Bring your numbers. Bring your best offer.
-
2026-04-07price $109,900 820-char remark
Show marketing remark (820 chars)
INVESTOR OPPORTUNITY – 1936 FIXER UPPER IN BELLS, TX If you’re looking for your next value-add project, this is it. Built in 1936, this property has strong bones, original hardwood floors ready for restoration, and the kind of character you simply can’t replicate in new construction. This is not a lipstick flip. This is a true renovation opportunity priced accordingly. The structure gives you a solid starting point — now it’s about vision, execution, and margin. Whether you’re a flipper looking for spread, a buy-and-hold investor wanting forced appreciation, or someone who knows how to unlock hidden value, this is your chance to create equity the old-fashioned way. Priced to sell due to condition. Bring your contractor. Bring your numbers. Bring your best offer.
-
2026-03-02$124,900 Active 820-char remark
Show marketing remark (820 chars)
INVESTOR OPPORTUNITY – 1936 FIXER UPPER IN BELLS, TX If you’re looking for your next value-add project, this is it. Built in 1936, this property has strong bones, original hardwood floors ready for restoration, and the kind of character you simply can’t replicate in new construction. This is not a lipstick flip. This is a true renovation opportunity priced accordingly. The structure gives you a solid starting point — now it’s about vision, execution, and margin. Whether you’re a flipper looking for spread, a buy-and-hold investor wanting forced appreciation, or someone who knows how to unlock hidden value, this is your chance to create equity the old-fashioned way. Priced to sell due to condition. Bring your contractor. Bring your numbers. Bring your best offer.
-
2025-11-25historical
-
2025-09-06price $159,900
-
2025-07-22$174,900 Active
-
2008-10-09soldstatus
-
1990-12-21soldstatus
ⓘ Source: listings_history table (triggers on properties + properties_extension) + one-shot
backfill from property_details.listing_events for pre-trigger history.
Tax reassessment forecast TX · Resets to sale price
- Current annual tax
- $3,376 · $281/mo
- Projected year-2 tax
- $3,376 · $281/mo
- Expected delta
- $0/yr ($0/mo · -0.0%)
ⓘ Screening estimate from a state-policy table — verify with the county assessor before closing.
Climate risk First Street
- Flood 1/10 Low FEMA zone X (unshaded) · 0% chance over 30 yrs
- Wildfire 7/10 Severe
- Heat 6/10 Major 7 d/yr ≥109°F today · 21 d/yr by 30 yrs out
- Wind 5/10 Major 26% chance of damaging wind over 30 yrs
- Air quality 2/10 Low 1 unhealthy d/yr today · 2 by 30 yrs out
Nearby sold comps map
Loading sold comps map…
Walkable amenities ~0.75 mi
Loading nearby amenities…
Taxation est. · year 1
- Rental income
- $12,081
- − Mortgage interest
- −$5,602
- − Property taxes
- −$3,376
- − Insurance
- −$500
- − Repairs & maintenance
- −$966
- − Management
- −$966
- − Depreciation
- −$2,909
- Taxable loss
- −$2,239
- Est. tax savings @ 24.0%
- +$537
- After-tax cash flow
- $-88/yr
For passive investors: Depreciation is non-cash, so a rental often shows a tax loss while cash-flowing — sheltering income. Rental losses are passive: they offset passive income freely, and up to $25,000/yr can offset ordinary (W-2) income if you actively participate and your MAGI is under $100k (phasing out to $0 by $150k); unused losses carry forward. On sale, claimed depreciation is recaptured at up to 25%, and gains may owe capital-gains tax (a 1031 exchange can defer both). Figures are a year-1 estimate at your 24.0% rate — not tax advice; consult a CPA.
Schools (NCES district)
- District
- Bells ISD
- NCES district ID
- 4809780
- Math proficiency
- 63% ▼ -1.00%
- Reading proficiency
- 53% ▼ -3.00%
- Median HH income
- $53,905
- Composite
- 49.84/100
- National rank
- #1949
- State rank
- #81 of 826 in TX
Livability — Bells
- Score
- 64/100
- State rank
- #769
- US rank
- #14037
Category grades
Schools grade is shown separately in the Schools card above.
Census & demographics
- Census place
- Bells, TX
- Population (ZIP)
- 3,417
Population outlook (Grayson County) Hauer SSP2
- Today (2025)
- 134,540 people
- By 2030
- 138,653 · +3.1%
- By 2040
- 145,958 · +8.5%
- By 2050
- 151,218 · +12.4%
- By 2075
- 161,802 · +20.3%
- By 2100
- 159,036 · +18.2%
Race, ethnicity, and origin ACS 2023
- Neighborhood character
- Predominantly White (91%)
- Race & ethnicity
- White 91% Hispanic / Latino 6% Two or more races 2% Native American 1% Asian 1%
- Hispanic origin (detail)
- Mexican 5%
- Common ancestry
- Slovak 6% Italian 2% Romanian 2%
- Foreign-born
- 2% · China, Canada
- Languages at home
- 97% English-only · Spanish 2% Other Indo-European 1% Chinese 1%
Political lean MEDSL · Grayson
- 2024 margin
- Solid R (+54.3) · D 22.5% · R 76.7%
- 2008→2024 swing
- -16.4pp toward R · 2008: -37.9pp · 2024: -54.3pp
- All cycles
- 2024: R+54.3 2020: R+49.9 2016: R+53.1 2012: R+48.0 2008: R+37.9
Not yet ingested
- Civics
- —
Market trends
- HPI YoY
- ▼ -26.31%
- Current HPI
- 257.42
- Rent YoY
- —
- Metro
- —
- State GDP YoY
- ▲ 3.95%
- F500 in state
- 110
Industry mix (Fortune 500 HQ in TX)
| Industry | F500 HQs | Revenue |
|---|---|---|
| Energy | 16 | $1,198B |
|
||
| Technology | 5 | $198B |
|
||
| Engineering / Construction | 4 | $72B |
|
||
| Energy Services | 3 | $60B |
|
||
| Utilities | 3 | $41B |
|
||
| Healthcare | 2 | $330B |
|
||
Price history
-42.8% since first listed8 events — show timeline
- 2026-04-22 Price Changed $100,000 NTREIS
- 2026-04-07 Price Changed $109,900 NTREIS
- 2026-03-02 Listed $124,900 NTREIS
- 2025-11-25 Listing Removed — NTREIS
- 2025-09-06 Price Changed $159,900 NTREIS
- 2025-07-22 Listed $174,900 NTREIS
- 2008-10-09 Sold (Public Records) — Public Records
- 1990-12-21 Sold (Public Records) — Public Records
Property tax history
+7.0%/yrLatest (2025): $3,376 · -1.8% YoY. Source: county tax records.
Cash-flow waterfall
monthlySold comps — $/sqft
last 12 mo · ≤1 miLoading sold comps…